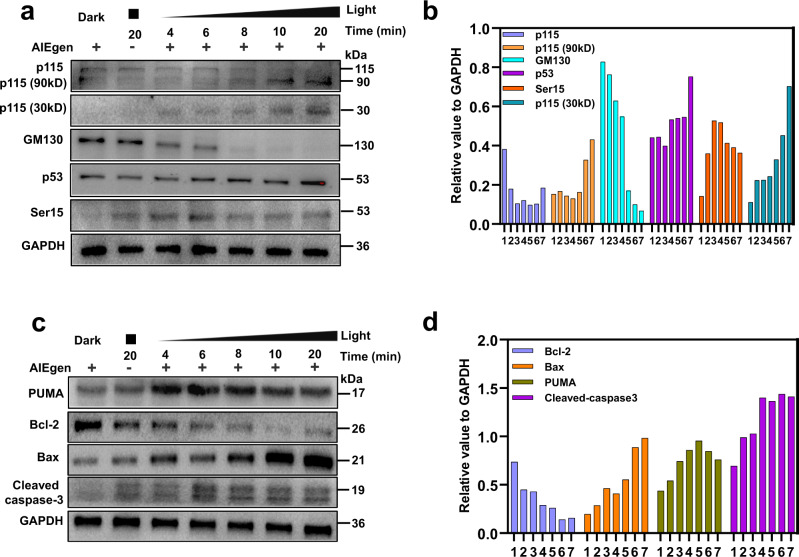
Fig. 7. Golgi apparatus and mitochondria associated protein expression after PDT.
The expressions of p115, p115 (90 kD), p115 (30kD), GM130, p53, ser15 in Golgi apparatus (a) and PUMA, Bcl-2, Bax, caspase-3 in mitochondria (c) after different treatment with TPE-PyT-CPS (0.2 μM) under light irradiation (25 mW cm−2). (b) and (d) western blot statistical chart of the relative expression levels of protein expressions in different treating groups (1. dark; 2. only light, 20 min; 3-7: with light and TPE-PyT-CPS for 4, 6, 8, 10 and 20 min, respectively) by imageJ and the value of protein expression is relative to GADPH. The experiments were performed two times independently with similar results, representative images are shown. Source data are provided as a Source Data file.

