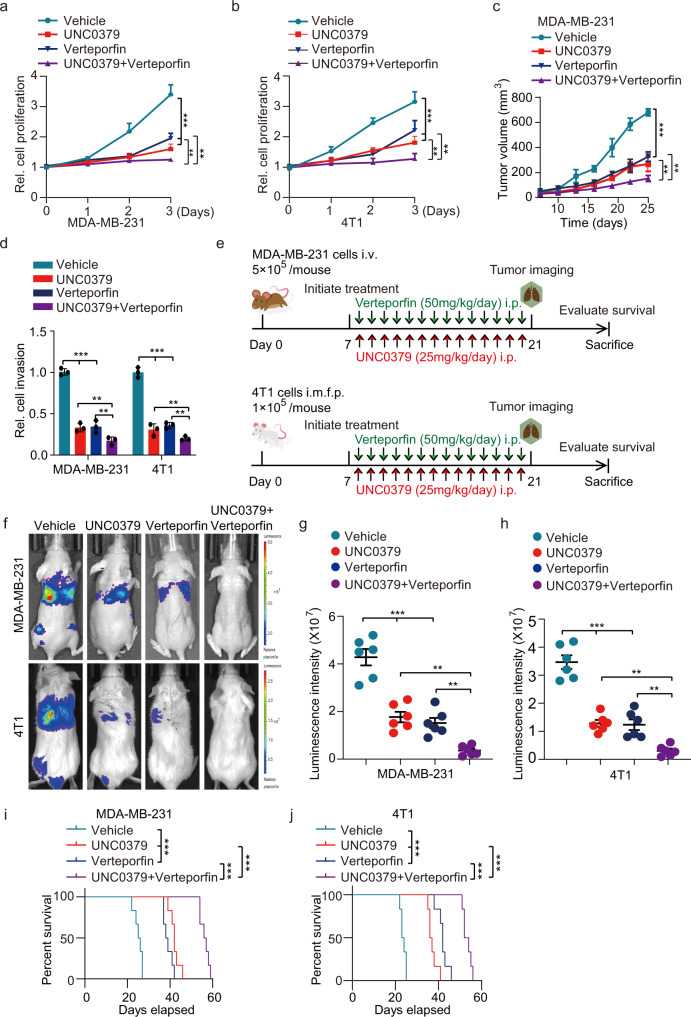
Fig. 7. KMT5A catalytic activity depletion combined with YAP signaling inhibition impedes triple-negative breast cancer progression.
a, b Effects of UNC0379 or/and verteporfin on MDA-MB-231 and 4T1 cells proliferation. Cells were treated with UNC0379 (5 μM), verteporfin (10 μM) or placebo (vehicle) as indicated (n = 3). c Cells generated in (a) were subjected to mouse xenograft assays by orthotopic injection in athymic nude mice, then 7 days after cell inoculation, these mice were treated with either verteporfin (50 mg/kg, i.p.) or/and UNC0379 (25 mg/kg, i.p.) daily for another 14 days, and tumor sizes were monitored and analyzed (n = 6 mice per group). d Invasion analysis of MDA-MB-231 and 4T1 cell lines treated with UNC0379 or/and verteporfin. Cells were treated with UNC0379 (5 μM), verteporfin (10 μM) or placebo (vehicle) as indicated (n = 3). e Treatment schedules for the administration of UNC0379 (25 mg/kg, intraperitoneal injection once daily) or/ and verteporfin (50 mg/kg, intraperitoneal injection once daily) to mice grafted with MDA-MB-231 cells (upper) or 4T1 cells (lower). Control mice received placebo (vehicle). Intravenous injection (i.v.). Orthotopic mammary fat pad injection (i.m.f.p.). Intraperitoneal injection (i.p.) (n = 6 mice per group). f Representative bioluminescence images in (e) on day 21. g, h Quantification of the bioluminescence activity of MDA-MB-231 (g) and 4T1 (h) tumor xenografts from UNC0379 or/and verteporfin treated and control mice in (e). i, j Kaplan–Meier survival analysis of mice with MDA-MB-231 (i) and 4T1 (j) tumor xenografts (n = 6 mice per group). Data information: In (a–c), statistical analysis was performed by a two-tailed t-test. In (d, g, h), by two-tailed Student’s t-test or one-way ANOVA. In (i, j), by log-rank test. ***P < 0.001, **P < 0.01. Data are represented as mean ± SEM. Panels (a–d) and (f–j) show one experiment representative of three independent experiments with similar results.

