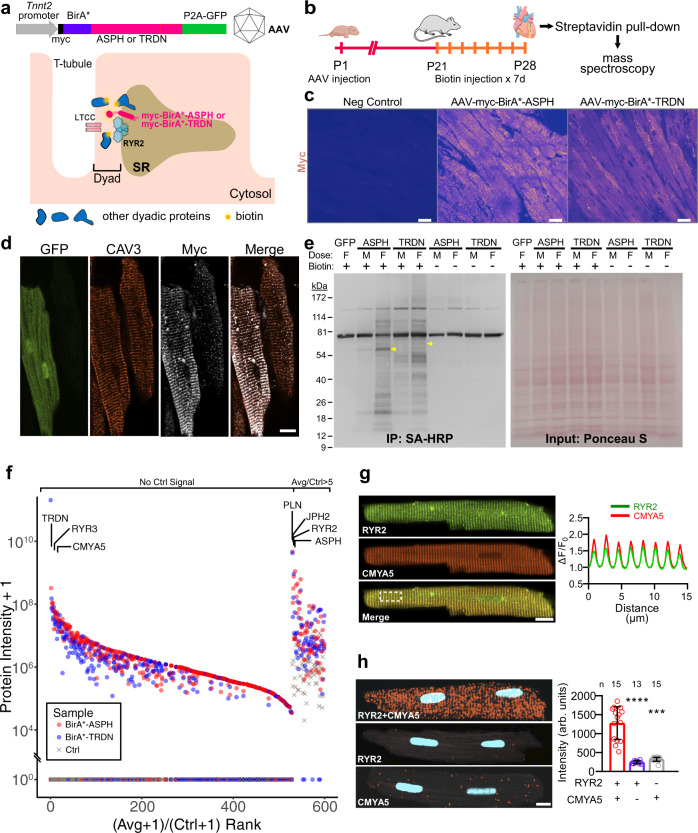
Fig. 1. BioID identification of dyadic proteins.
a Proximity proteomics strategy. BirA* and myc epitopes were fused to ASPH and TRDN, which interact with RYR2 in jSR of dyads. N-terminal fusion positions BirA* in the dyadic cleft. The fusion protein was expressed in vivo in cardiomyocytes using AAV9 and the cardiomyocyte-selective troponin T (Tnnt2) promoter. GFP was co-expressed using a P2A sequence. b Experimental timeline. Artwork from biorender.com. c Expression of BirA* dyadic biosensors in myocardium. Heart sections were stained for the myc epitope tag. Most cardiomyocytes were immunoreactive. Bar = 20 µm. Representative of 3 independent experiments. d Mature ventricular cardiomyocytes. In the left GFP + cell, myc immunoreactive signal co-localized with CAV3, a T-tubule marker. Bar = 10 µm. Representative of three independent experiments. e Protein lysates from mice expressing the indicated BirA*-fused biosensors or GFPs were analyzed by western blotting. AAV dose and treatment with exogenous biotin are indicated. M, middle dose (2 × 10¹⁰ vg/g). F, full dose (5.5 × 10¹⁰ vg/g). Ponceau S, total protein. SA-HRP labeled biotinylated proteins. Representative of two independent experiments. f Summary of mass spectrometry data. Red and blue symbols indicate protein signals from BirA* biosensors. Gray symbols show control (AAV-GFP) signals. One replicate pooled from three hearts was performed for each sensor and for control. Proteins were ranked by the ratio of the average signal of the two different BirA* biosensors to the control signal. Proteins lacking control signal grouped to the left. Only proteins with average/control ratio >5 are shown. g Co-localization of CMYA5 and jSR marker RYR2. Immunostained adult cardiomyocytes were imaged with a confocal microscope. Spatial profiles to the right demonstrate co-localization in a striated pattern with 2 µm spacing. Bar = 10 µm. h Proximity ligation assay. Punctate red signal, indicating close proximity of RYR2 and CMYA5, was observed when both RYR2 and CMYA5 antibodies were included, but not with either in isolation. Signal intensity is quantified at the right. n, number of cardiomyocytes. Two-sided Kruskal–Wallis with Dunn’s multiple comparison test vs. RYR2 + CMYA5: ***, P < 0.001; ****, P < 0.0001. Data are presented as mean ± SD. Bar = 10 µm.

