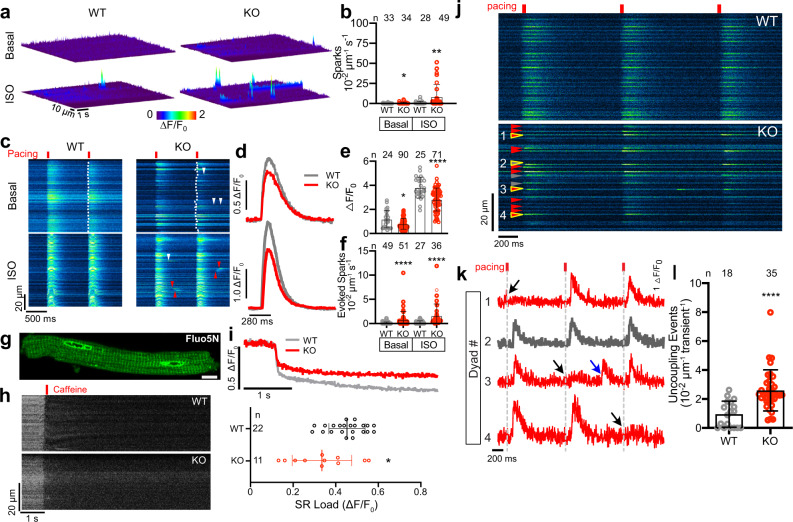
Fig. 4. Altered dyadic Ca2+ release in CMYA5 KO cardiomyocytes.
Ca2+ release in mature Cmya5 KO or WT ventricular cardiomyocytes was assessed using a dyad-localized Ca2+ nanosensor, GCaMP6f-Junctin (ASPH-G6f) and detected by confocal line scan imaging. a, b Surface plots of Ca2+ sparks in basal and isoproterenol (ISO)-stimulated (100 nM) cardiomyocytes. Quantification is shown in (b). Mann-Whitney test within basal or ISO conditions. c–f Ca2+ release during electrical pacing (red lines) under basal conditions or ISO stimulation. Dotted line, leading edge of the evoked Ca2+ transient. Arrowheads, aberrant Ca2+ release outside of the initial evoked Ca2+ transient, without (white) or with (red) wave-like propagation. d. Representative Ca2+ transients under basal (top) or ISO (bottom) conditions. e, f Quantification (mean ± SD) of Ca2+ transient amplitude and Ca2+ spark frequency. Mann-Whitney test within basal or ISO conditions. g–i Measurement of SR Ca2+ stores using low-affinity Ca2+-sensitive dye Fluo5N and AAV-mediated expression of SR-targeted esterase, which trapped Fluo5N in SR. g, Fluo5N distribution. h, i SR Ca2+ release induced by 10 mM caffeine. g–i are representative of three independent experiments. Caffeine-induced change in Fluo5N signal yielded an estimate of SR Ca2+ stores (mean ± SD). t test. Bar = 10 µm. j Ca2+ release at dyads of electrically paced cardiomyocytes was recorded using the ASPH-G6f dyad-targeted Ca2+ nanosensor. Gray arrowheads, consistently coupled dyads (activated with each electrical pacing event). Red arrowheads, inconsistently coupled dyads (activated with some pacing events but not others). k Fluorescence intensity profiles over time of yellow outlined dyads in j, numbered 1–4. Dyad 2 was consistently coupled, whereas dyads 1, 3, and 4 were inconsistently coupled. Black arrows, lack of activation with electrical pacing. Blue arrow, evoked Ca2+ spark not coordinated with the overall Ca2+ transient. l Frequency of inconsistently coupled dyads in WT and KO cardiomyocytes, with and without ISO stimulation. The number of pacing events without dyadic Ca2+ release over three consecutive calcium transients was normalized to line scan length. n, number of cardiomyocytes. Mann–Whitney test within basal or ISO conditions. *, P < 0.05; **, P < 0.01; ****, P < 0.0001. Two-sided statistical tests were used. Data are presented as mean ± SD.

