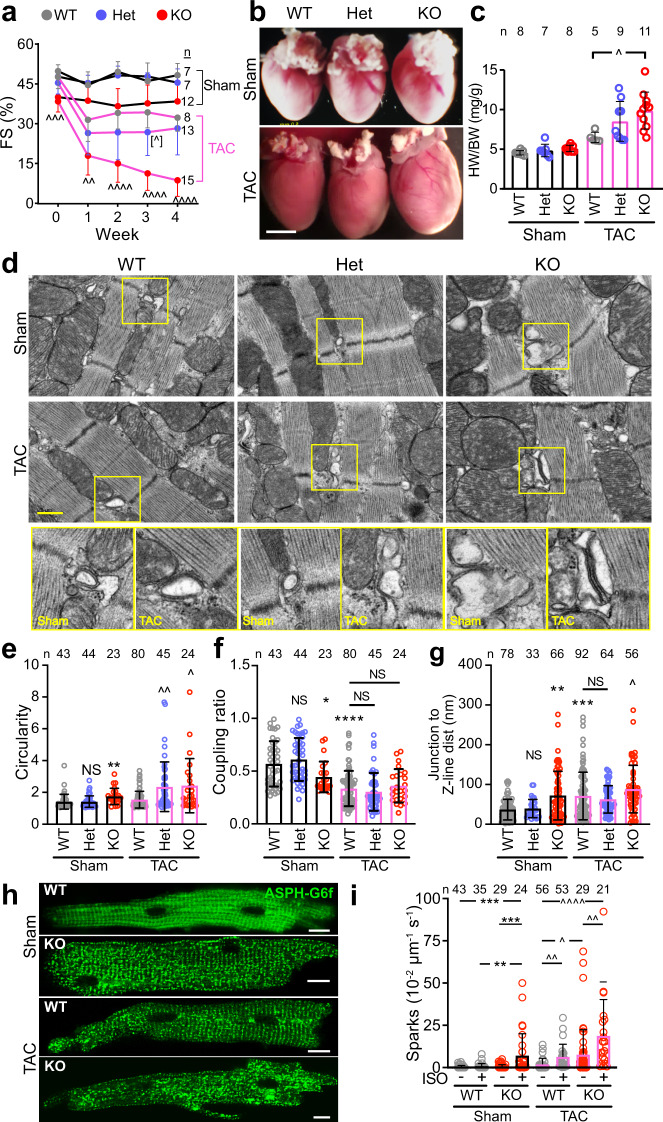
Fig. 5. CMYA5 protects the heart and dyads from the deleterious effects of pressure overload.
Cmya5 KO and WT mice underwent baseline echocardiography (week 0) and then TAC or Sham surgery. After 4 weekly echocardiograms, necropsy was performed. a Systolic heart function. FS fractional shortening. Repeated-measures two-way ANOVA was performed for TAC cohort, with a comparison to WT-TAC (∧) at each time point. n, number of mice. b Gross cardiac morphology. Bar, 2.5 mm. c Heart weight normalized to body weight. Kruskal-Wallis with Dunn’s multiple comparison test vs.WT within Sham (*) or TAC (∧) cohorts. n number of mice. d–g Dyad architecture analyzed by transmission electron microscopy. Boxed regions are magnified in the bottom row. Bar, 500 nm. Quantification of T-tubule circularity, jSR-to-T-tubule coupling ratio, and Junction-Z-line distance. Kruskal–Wallis with Dunn’s multiple testing correction vs. WT Sham (*) or TAC (∧). n, number of dyads per group, from at least 10 cardiomyocytes from 3 different mice. h, i Cardiomyocytes were transduced with dyad-localized ASPH-G6f Ca2+ nanosensor. Images of nanosensor distribution indicate dyad disorganization induced by TAC and Cmya5 KO (h). Quantification of Ca2+ sparks by confocal line scan imaging of nanosensor. Kruskal–Wallis with Dunn’s multiple testing correction within Sham (*) or TAC (∧). n, number of cardiomyocytes per group. ∧, P = 0.054; ∧ or *, P < 0.05; ∧∧ or **, P < 0.01; ∧∧∧ or ***, P < 0.001; ∧∧∧∧ or ****, P < 0.0001. Two-sided statistical tests were used. Data are presented as mean ± SD.

