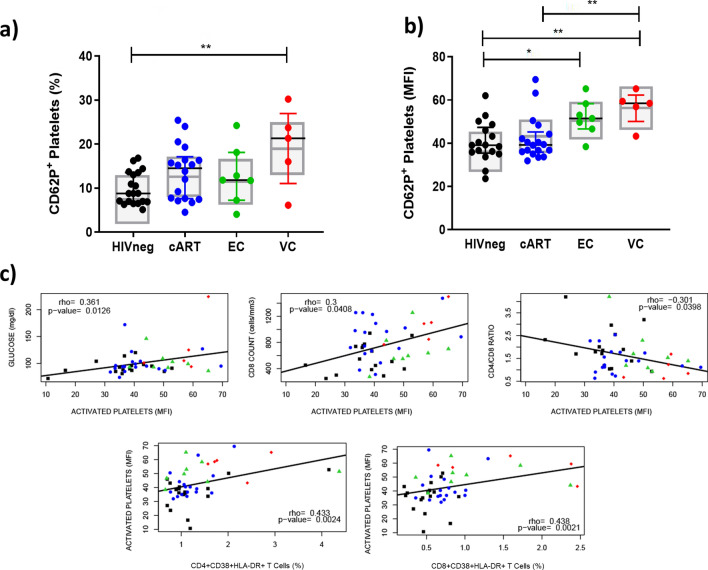
Figure 2.
Frequency of activated platelets in HICs and control groups. (A) Frequencies of CD62P+ platelets; (B) Median fluorescence intensity of CD62P in the platelet population; (C) Spearman correlations between activation of platelets and other markers evaluated in the study; Colored horizontal bars represent the IQR and sample median, while gray boxplots represent linear model estimated marginal sample-bias adjusted means and its 95% confidence intervals (CI 95%). Comparisons of estimated marginal means among groups were performed by T-tests of contrasts obtained after multivariate-linear models fitted by ordinary least square regressions. p-values were corrected by the Tukey Honest Significant Difference post hoc method and represented as: *p < 0.05; **p < 0.01; ***p < 0.001; ****p < 0.0001. Comparison graphs were plotted with Graphpad Prism v9 and correlation graphs were plotted with R software v4.1.

