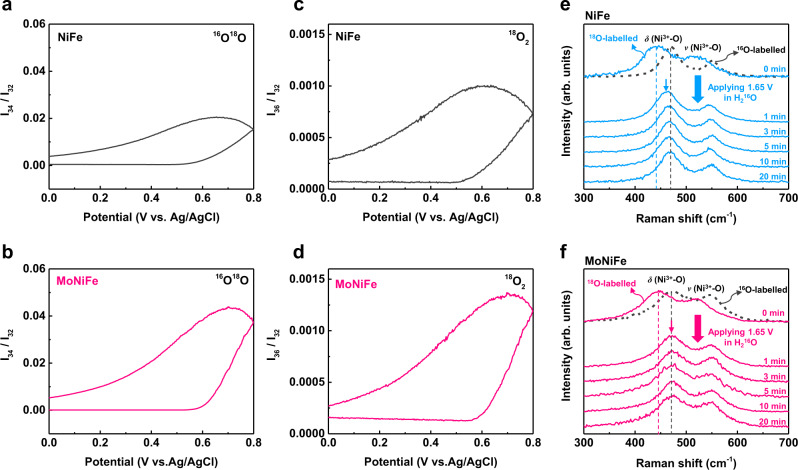
Fig. 3. Evidence of lattice oxygen participating in OER provided by 18O isotope-labeling experiments.
Mass spectrometric cyclic voltammograms results showing different gaseous products content of OER reaction as a function of applied potential for the 18O-labeled samples: 16O18O for a NiFe (oxy)hydroxide and b MoNiFe (oxy)hydroxide, 18O2 for c NiFe (oxy)hydroxide and d MoNiFe (oxy)hydroxide. The contents of all the species were normalized by the amount of 16O2 in the reaction products. Quasi in-situ Raman spectra of e 18O-labelled NiFe and f 18O-labelled MoNiFe (oxy)hydroxides after being applied a positive potential of 1.65 V (vs. RHE) in 1.0 M KOH with H216O for different time (1 min to 20 min). The Raman spectra of 16O-labelled samples were shown in black dash lines for comparison.

