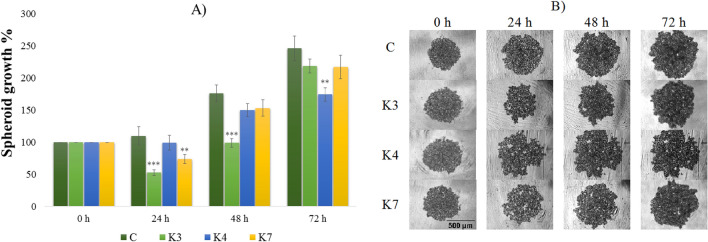
Figure 4.
The impact of K3, K4, and K7 (1 µM) on resistant HOC/ADR spheroids formation after 24, 48, and 72 h exposure (A). Representative images of resistant HOC/ADR spheroids at 0 to 72 h of experiment (B), scale bar = 500 µm. The control spheroids (C) were treated with 1% V/V DMSO. After incubation, the spheroid areas were determined and the spheroid growth was calculated (A, relative to control). Data are expressed as the average of spheroid growth (%) of nine repetitions with the corresponding standard error of the mean. The statistical differences between the control spheroids and treated spheroids were calculated by using a two-compound t-test at the level *p < 0.05, **p < 0.01, ***p < 0.001.

