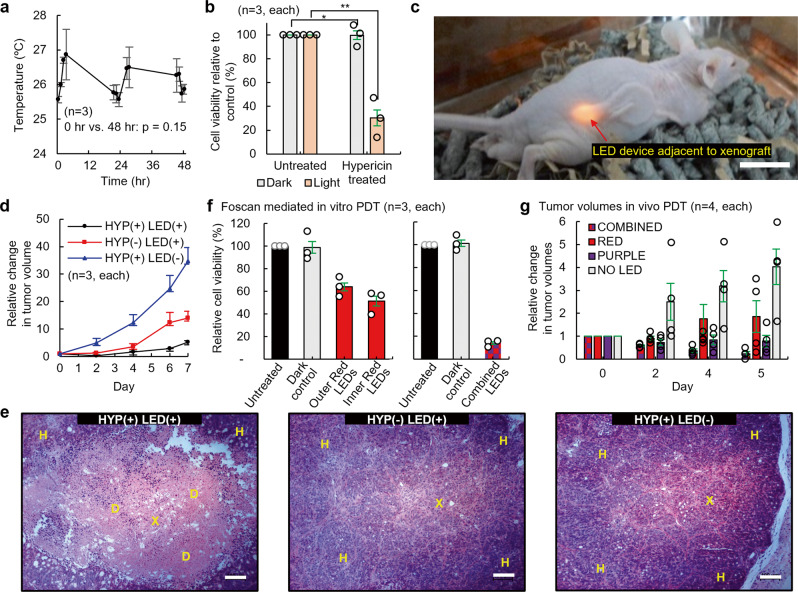
Fig. 5. Hypericin and Foscan mediated in vitro and in vivo PDT.
a LED devices were continuously switched on and the operating temperatures of devices were measured over 48 h. b HT29 cells were seeded into 24-well plates and incubated with 200 nM Hypericin in the dark. LEDs were positioned under the wells and cells were treated with 36 mJ cm−2 of light for an hour. After 24 h, cell viability was assessed. Subcutaneous HT29 tumor xenografts were generated in BALB/c nude mice and the LED devices implanted adjacent to tumor xenografts. LEDs were switched on and Hypericin was administered every 24 hours to a total of 3.5 mg kg−1 of Hypericin and 12.1 J cm−2 of light. c Photograph of a mouse with a device implanted; scale bar 1 cm. d Tumor volumes were recorded for a week. The HYP(−)LED(+) group received LED light treatment only. The HYP(+)LED(−) group received Hypericin treatment only. The HYP(+)LED(+) group received both light and Hypericin treatments. e Tumor xenografts were harvested following in vivo PDT, fixed in 4% PFA, embedded into paraffin, sectioned, and subjected to H&E staining; scale bar 100 μm. Images shown are representative examples of H&E staining performed on 3 different group. f HT29 cells were seeded into 24-well plates and incubated with 100 nM Foscan in the dark. Dual-channel LED devices were positioned under the wells and cells were treated with 1.8 mJ cm−2 of light. Proposed devices contained either all Red LEDs (Red LED light treatment, left) and combined Red/Purple LEDs (30 mins outer red LEDs treatment followed by 30 mins inner purple LEDs, right): Outer denotes peripheral 4 LEDs of an implantable device and Inner indicates central 4 LEDs of it (Fig. 4e). g Tumor volumes were recorded for 5 days. All groups received Foscan. The combined group received both red and purple LED light treatment. The red and purple groups received red and purple LED light treatments only. No LED group received no LED light treatment. Data are presented as mean values ± SD; Two-sided unpaired t-test was used for statistical data analysis; *p = 0.95; **p = 0.002; X = Xenograft, H = Healthy tissue, D = Dead tissue.

