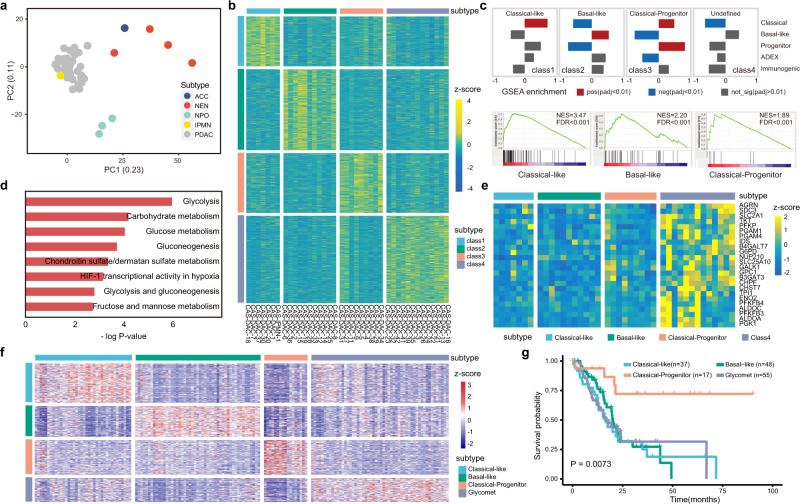
Fig. 3. Transcriptome analysis of PDPCOs.
a PCA of gene expression for 45 PDPCOs in the discovery cohort: 39 CAS-DACs, 4 CAS-NENs, 1 CAS-IPMN and 1 CAS-ACC. b Heatmap of the four transcriptomic subtypes in the discovery cohort of 40 exocrine PDPCOs (39 CAS-DACs and 1 CAS-IPMN), as revealed by unsupervised NMF clustering. Samples are listed in columns, and signature genes are listed in rows as z-scores. c Identification of biological characteristics in each subtype by previously reported signatures. A P-value < 0.01 was used to determine positive or negative enrichment of published signatures in a subtype (top). Detailed GSEA results are shown at the bottom. d Bar graph showing the results of enrichment analysis of class 4 DEGs by Enrichr. Significance was computed by one-sided hypergeometric test. e Heatmap indicating the expression of glycolysis pathway-related genes across the four subtypes. Samples are listed in rows, and signature genes are listed in columns as z-scores. f External validation of the transcriptomic subtypes in the TCGA PAAD cohort. Samples are listed in rows, and signature genes are listed in columns as z-scores. g Kaplan-Meier survival analysis showing the overall survival characteristics of patients with the four transcriptomic subtypes, as identified in f. P value is determined by using log-rank test. PDPCO, patient-derived pancreatic cancer organoid; PDAC, pancreatic ductal adenocarcinoma; NEN, pancreatic neuroendocrine neoplasm; IPMN, intraductal papillary mucinous neoplasm; ACC, acinar cell carcinoma; NPO, normal pancreatic ductal organoid; PCA, principal component analysis; NMF, nonnegative matrix factorization; GSEA, gene set enrichment analysis; DEG, differentially expressed gene.

