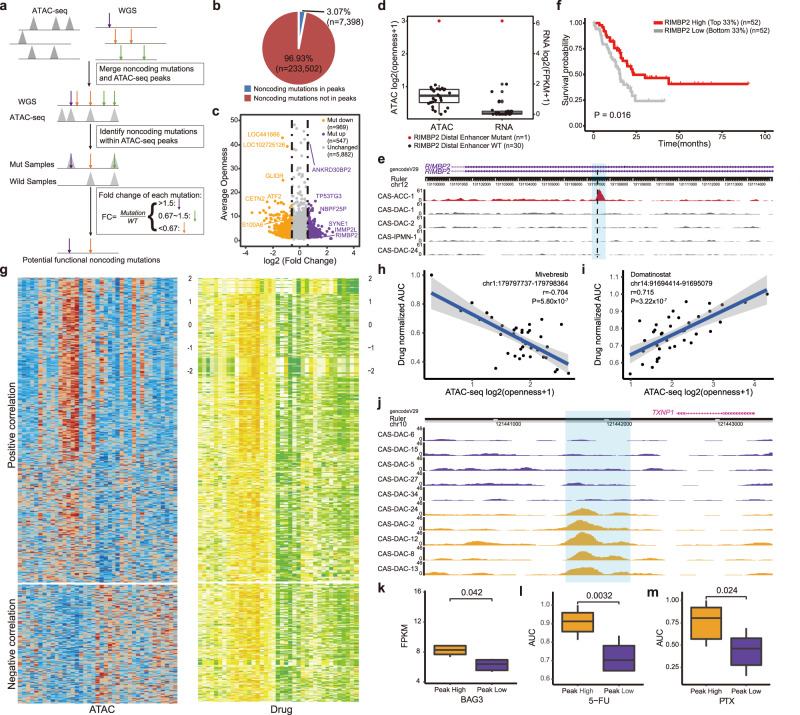
Fig. 5. Integrated analysis of noncoding mutations and drug sensitivity in PDPCOs.
a Schematic for identifying potential functional noncoding mutations in 31 exocrine PDPCOs. b Proportions of noncoding mutations located within and outside ATAC peaks. c Dot plot showing fold change in accessibility at ATAC-seq peaks containing noncoding mutations across above 31 exocrine PDPCO. d Box plot showing chromatin accessibility at RIMBP2 putative enhancer and RIMBP2 gene expression across above 31 exocrine PDPCOs. Boxplot show the median (central line), the 25–75% interquartile range (box limits). e Normalized ATAC-seq tracks of RIMBP2 putative enhancer locus in 5 representative samples. The red and gray tracks represent samples with and without mutation of the RIMBP2 putative enhancer, respectively. Black dotted line indicates the position of the mutation, and the predicted enhancer region is highlighted by light blue shading. f Kaplan-Meier analysis of overall survival in the TCGA PAAD cohort stratified by high and low expression of RIMBP2 gene. P value is determined by using log-rank test. g Heatmap of 15,397 putative peak-to-drug links in 39 exocrine PDPCOs. Each row represents an individual link between one ATAC-seq peak and one drug. The color represents the z-score for chromatin accessibility (left) or the z-score for drug AUC (right). Dot plot showing a representative negative correlation in h and a representative positive correlation in i. Significance is computed by Pearson’s correlation coefficients without adjustment. j Normalized ATAC-seq tracks of BAG3 putative enhancer locus in 10 representative samples. The yellow and purple tracks represent samples with and without peaks in BAG3 putative enhancer, respectively. The peak region is highlighted by light blue shading. Comparison between peak high group with peaks in the BAG3 putative enhancer and peak low group without such peaks in the above 10 samples of BAG3 gene expression in k, AUC of 5-FU in l and AUC of PTX in m. Each group contains 5 biologically independent samples. Boxplot show the median (central line), the 25–75% interquartile range (box limits). Significance is computed by two-sided unpaired t test. PDPCO, patient-derived pancreatic cancer organoid; AUC, area under curve; 5-FU, 5-fluorouracil; PTX, paclitaxel.

