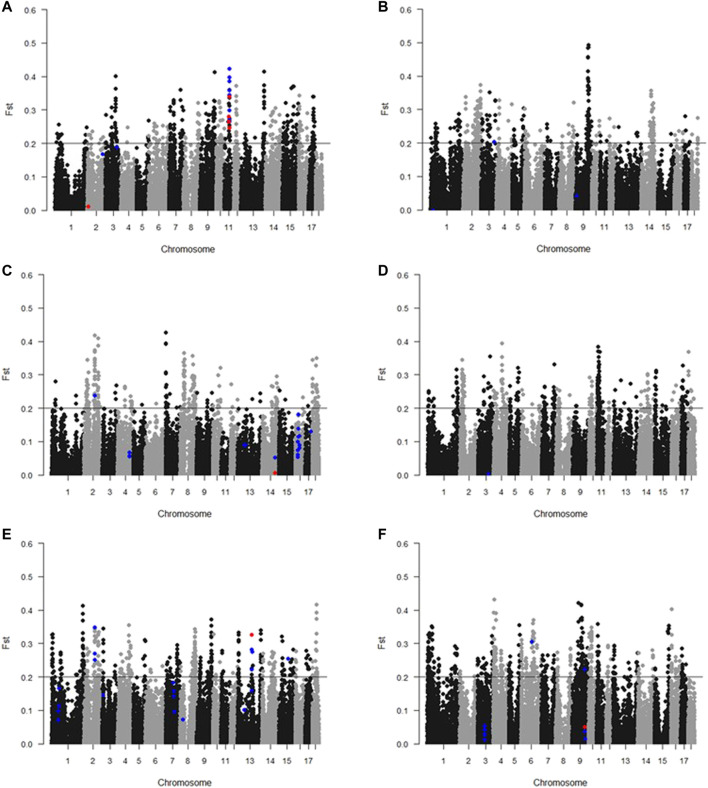
FIGURE 2.
Manhattan plots of FST of meat color. (A) L* 45 min; (B) L* 24 h; (C) a* 45 min; (D) a* 24 h; (E) b* 45 min; (F) b* 24 h. The x-axis indicates the chromosome (1-18) where the SNPs were located, and y-axis denotes the FST value. The line represents the threshold of differentiation (FST = 0.2). Blue dots and red dots represent SNPs that reached the suggestive significance threshold and genome-wide significance threshold, respectively.

