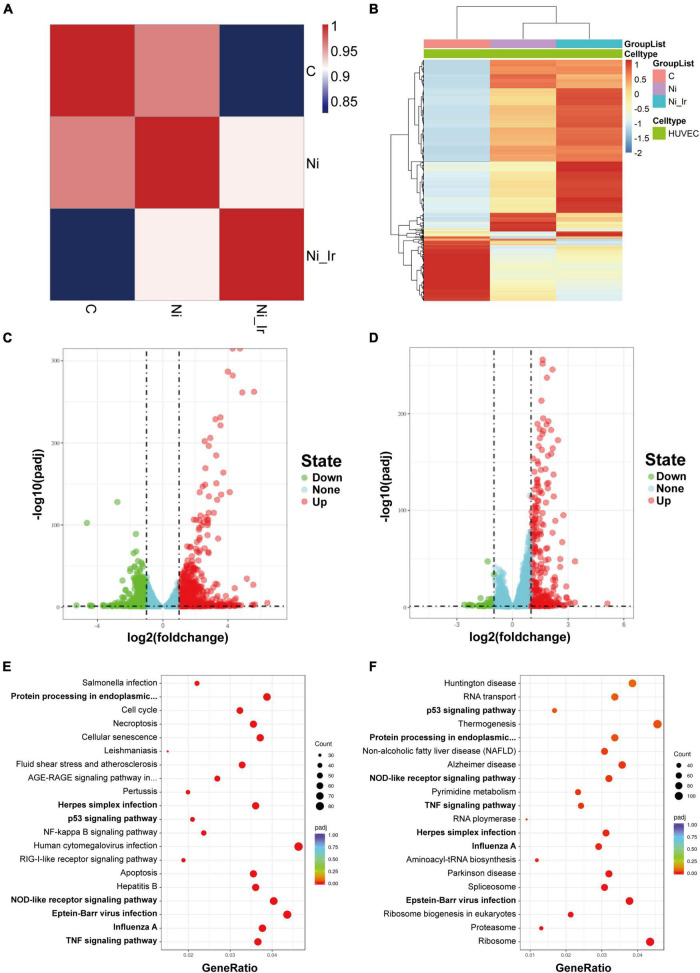
FIGURE 2.
Differentially expressed genes (DEGs) and enrichment analyses of endothelial cells treated with nicotine and irisin. (A) Correlation analysis of DEGs in the Control group (C), Nicotine group (Ni) and Nicotine + Irisin group (Ni_Ir). (B) Heatmap of the top 1,000 DEGs among the three groups. (C) Volcano plot of DEGs between the Ni group and C group (padj < 0.05, | log2fold change| > 1); (D) Volcano plot of DEGs between the Ni_Ir group and Ni group (padj < 0.05, | log2fold change| > 1); (E) KEGG pathway enrichment analysis of DEGs between the Ni group and C group; (F) KEGG pathway enrichment analysis of DEGs between the Ni_Ir group and Ni group.

