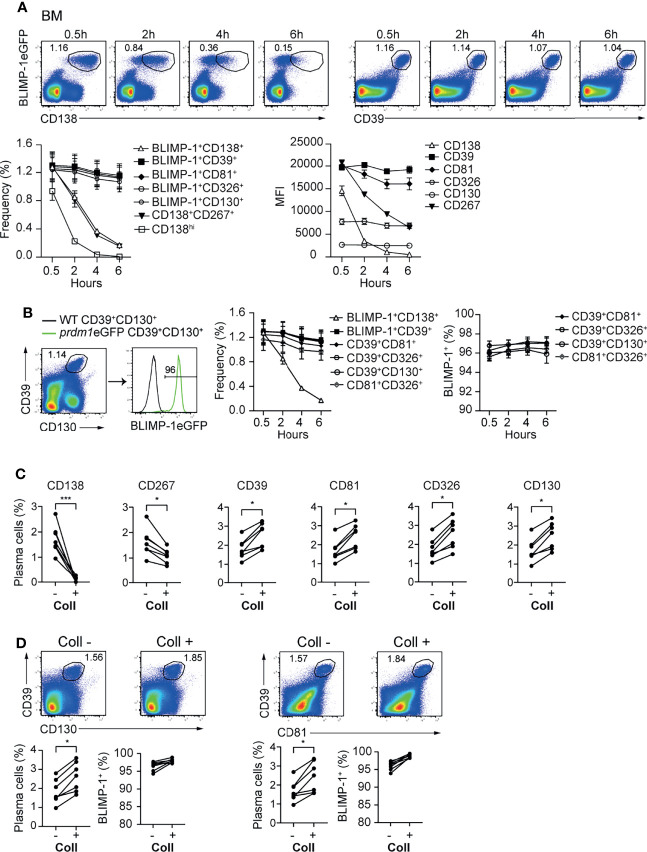
Figure 3.
CD39, CD81, CD130, and CD326 expression is stable and provides improved resolution for ASC identification. Analyses were performed with naive prdm1eGFP mice, unless indicated otherwise. (A) Representative FACS plots (top) showing the co-expression of BLIMP-1eGFP with CD138 or CD39 in BM at indicated time points after BM single cell suspension preparation. The populations were gated on CD3-live cells. Results are representative of two independent experiments (n=7 mice). The graphs show the frequency of detected ASC (left) (gated according to top FACS plots and Supplementary Figure 3B ) and MFI of indicated marker (right) in BLIMP-1eGFP+CD39+ ASCs (gated according to top right FACS plots). (B) Representative FACS plot demonstrating that ASCs gated based on the dual expression of CD39 and CD130 (left) are BLIMP-1eGFP+ (right). The graphs show the frequency of ASCs identified as BLIMP-1eGFP+CD138+, BLIMP-1eGFP+CD39+ (shown in A), CD39+CD130+ (shown in B), CD39+CD81+, CD39+CD326+ and CD81+CD326+ ( Supplementary Figure 3C ) (left), and the frequency of BLIMP-1eGFP+ expressing cells within the indicated ASC populations (right), during the time course after isolation. (C) Frequency of ASCs expressing BLIMP-1eGFP and given markers as shown in the Supplementary Figure 3D from spleen before and after collagenase (Coll) treatment. Populations were gated on CD3- live cells. (D) Representative FACS plots (top) and frequencies (left bottom) demonstrating that ASCs can be identified as CD39+CD130+ and CD39+CD81+ ASCs before and after Coll treatment. Frequencies of BLIMP-1eGFP+ cells within these gates (right bottom). Groups were compared using paired t test (C, D). Data show compilation of 2 independent experiments (n=7 mice). Data show mean ± SEM (*p < 0.05, ***p < 0.001).

