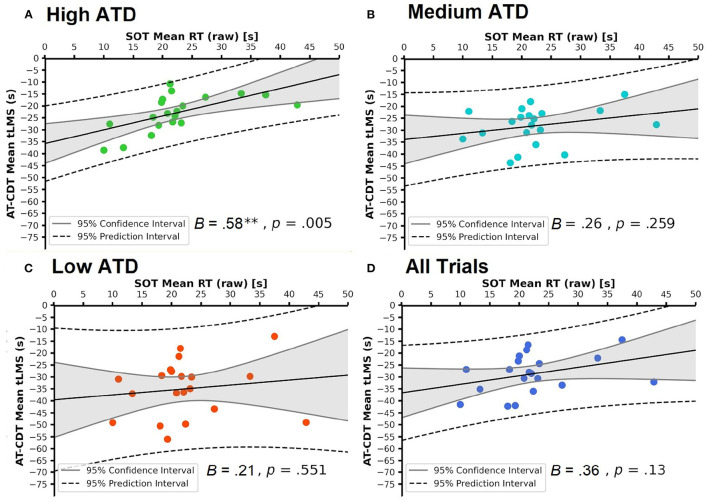
Figure 7.
Scatter-plots showing the linear relationships between mean Spatial Orientation Test (SOT) raw reaction time (RT) and mean Air Traffic Conflict Detection Task (AT-CDT) time to loss of minimum separation (tLMS) under each of (A–C) three air traffic density (ATD) conditions and over (D) all AT-CDT test trials. Raw regression coefficients are shown. (A) shows the significant correlation emanating from the high ATD condition. Ninety five percent confidence and prediction intervals are shown. In all plots, no data points lie beyond the 95% prediction interval, showing the absence of outliers.

