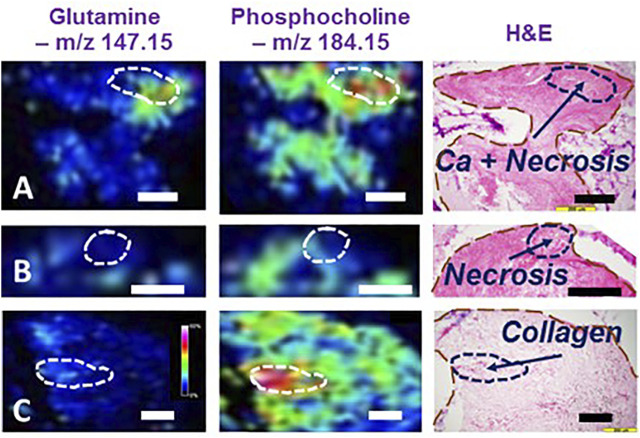
FIGURE 2.
Illustrations of MALDI MSI metabolomic maps of human lung cancer tissues. Interpretation of MALDI MSI results obtained from three human lung cancer cases according to tissue histology. (A) SCC, Stage I, M, 72.2y.o. (B) Adeno, I, F, 71.8, and (C) SCC, I, F, 59.6. In (A), the MSI region with high glutamine and phosphorylcholine intensities was correlated with a histological region featured by cancer lesions mixed with necroses. However, observing necroses alone, as shown in (B), neither of these two metabolites were overexpressed in the MSI. Furthermore, interpretation of the presence of phosphorylcholine requires caution for its increase in collagen was seen in (C) Black and white bars denote 200 μm.

