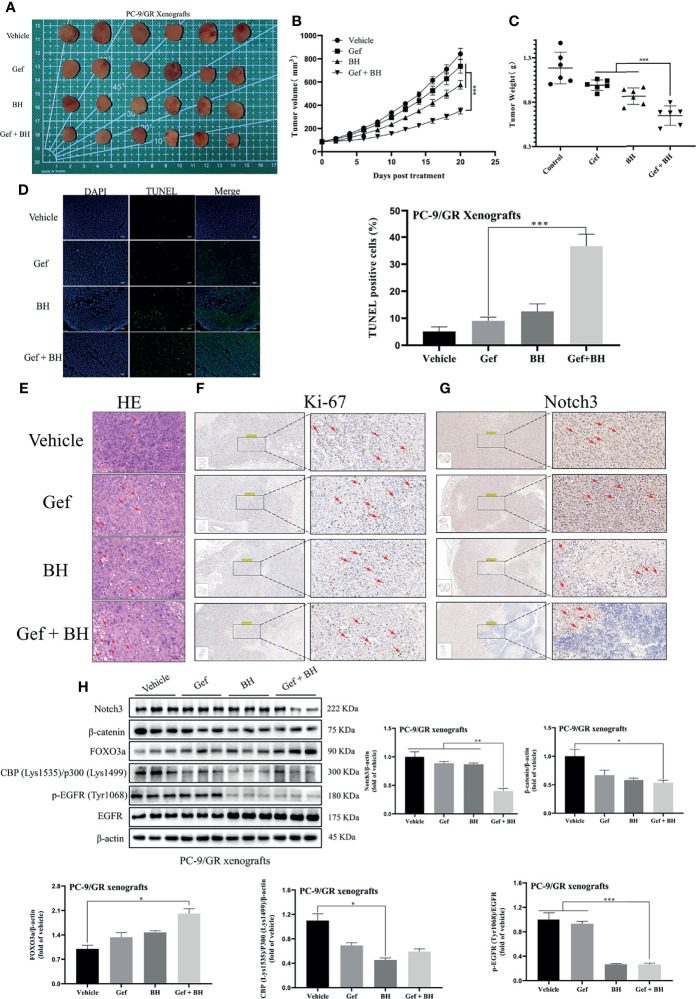
Figure 8.
Combination of BH and gefitinib suppressed the growth of PC-9/GR xenografts tumor. (A) Representative pictures of tumors. n = 6 per group. (B) Tumor volume of PC-9/GR xenografts. (C) Tumor weights and size of PC-9/GR xenografts. (D, E) TUNEL assay and H&E staining were performed to examine histological morphology and apoptosis of tumor tissues, and the scale bar was 100 μm. (F, G) The protein levels of Ki-67 and Notch3 of PC-9/GR xenografts were detected by IHC, and the scale bar was 200 μm. (H) The expressions of Notch3, β-catenin, FOXO3a, p-EGFR (Tyr1068), EGFR, and BPC (Lys1535)/P300 (Lys1499) of PC-9/GR xenografts were measured by Western blot. “*” represents Gef +BH group, BH group, Gef group vs. the group (*p < 0.05, **p < 0.01, ***p< 0.001).

