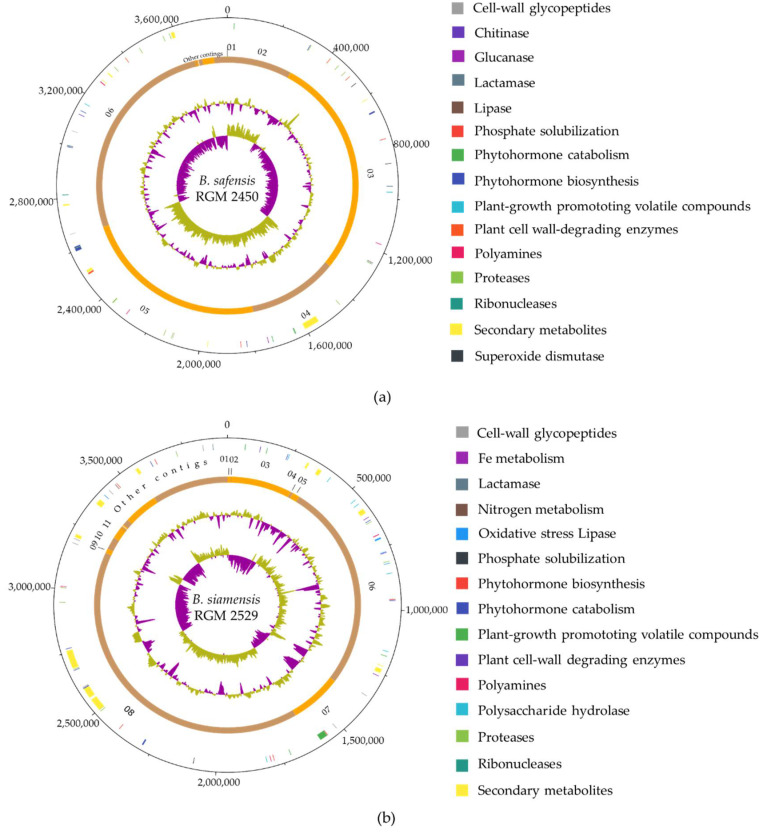
Figure 1.
Circular representation of the PGPR bacterial strain genomes. (a) B. safensis RGM 2450. (b) B. siamensis RGM 2529. Tracks from outside to inside: circle 1, nucleotide base position (bp) clockwise starting from zero; circle 2, biosynthesis gene clusters or extracellular enzymes genes detected are indicated by colored regions; circle 3, position of DNA contigs, light orange = odd-numbered contigs, dark orange = even-numbered contigs; circle 4, G + C nucleotide content plot, using a 10 kb window size, lime/purple peaks indicate values higher/lower than aver-age G + C content, respectively; circle 5, GC skew plot [(G − C)/(G + C)], using a 10 kb window size, lime/purple peaks indicate values higher/lower than 1, respectively.

