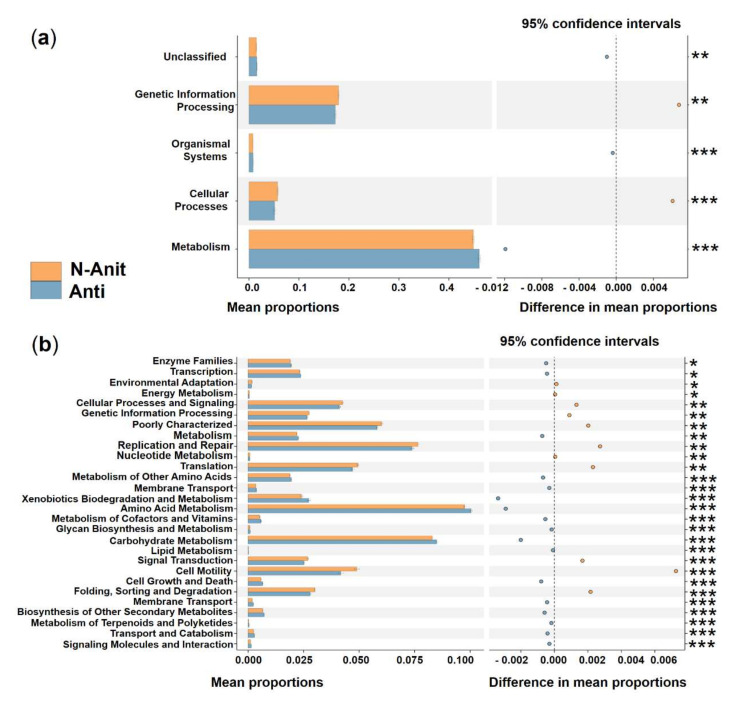
Figure 10.
Prediction of the differential function of bacterial associations between the N−Anti (orange) and Anti (blue haze) groups in KEGG categories at level 1 (a) and level 2 (b). Gene functions were predicted from 16S rRNA gene-based microbial compositions using the PICRUSt algorithm to make inferences from KEGG annotated databases. Relative signal intensity was normalized by the number of the genes for each indicated metabolic pathway. *, **, *** indicate the difference is at a significant level with p < 0.05, p < 0.01, and p < 0.001, respectively.

