Figure 8.
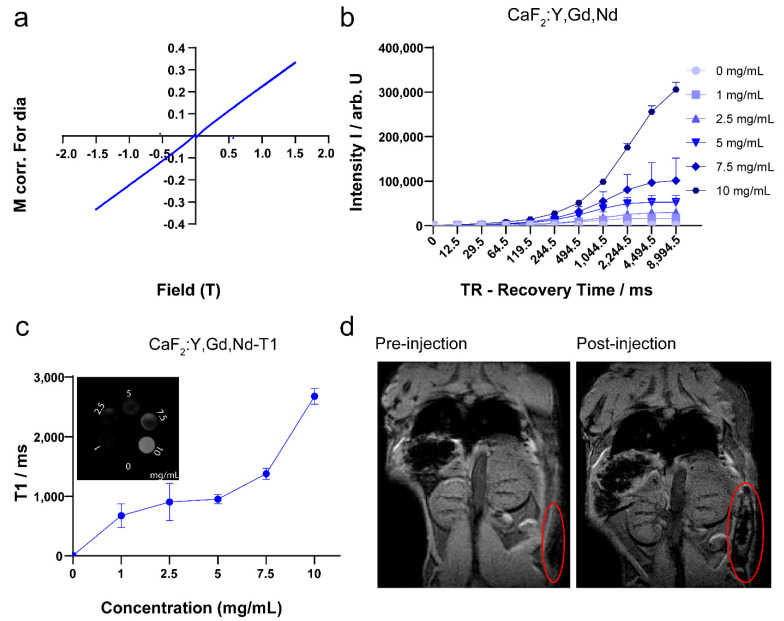
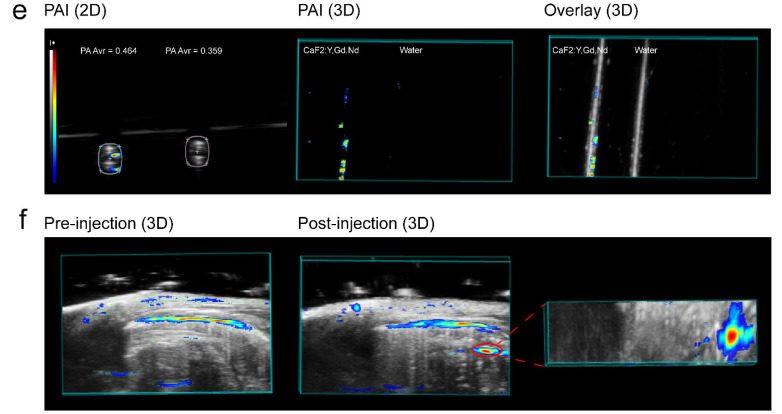
MRI and PAI performance of CaF2:Y,Gd,Nd NPs. (a) The VSM measurement of CaF2:Y,Gd,Nd NPs; (b) MRI signal intensity of different concentrations of CaF2:Y,Gd,Nd NPs with increasing recovery time; (c) in vitro T1 relaxation rates of different CaF2:Y,Gd,Nd NP concentrations; inset shows T1-weighted MRI images of CaF2:Y,Gd,Nd NPs at different concentrations in 0.5 % agarose gel; (d) ex vivo MRI images before and after subcutaneous injection of CaF2:Y,Gd,Nd NPs (10 mg/mL) into a mouse cadaver; (e) in vitro PA images (2D and 3D) of CaF2:Y,Gd,Nd NPs (10 mg/mL), water is the control; (f) ex vivo PA images (3D) before and after injection of CaF2:Y,Gd,Nd NPs (10 mg/mL) into a mouse. Unspecific signal is caused by endogenous tissue chromophores.


