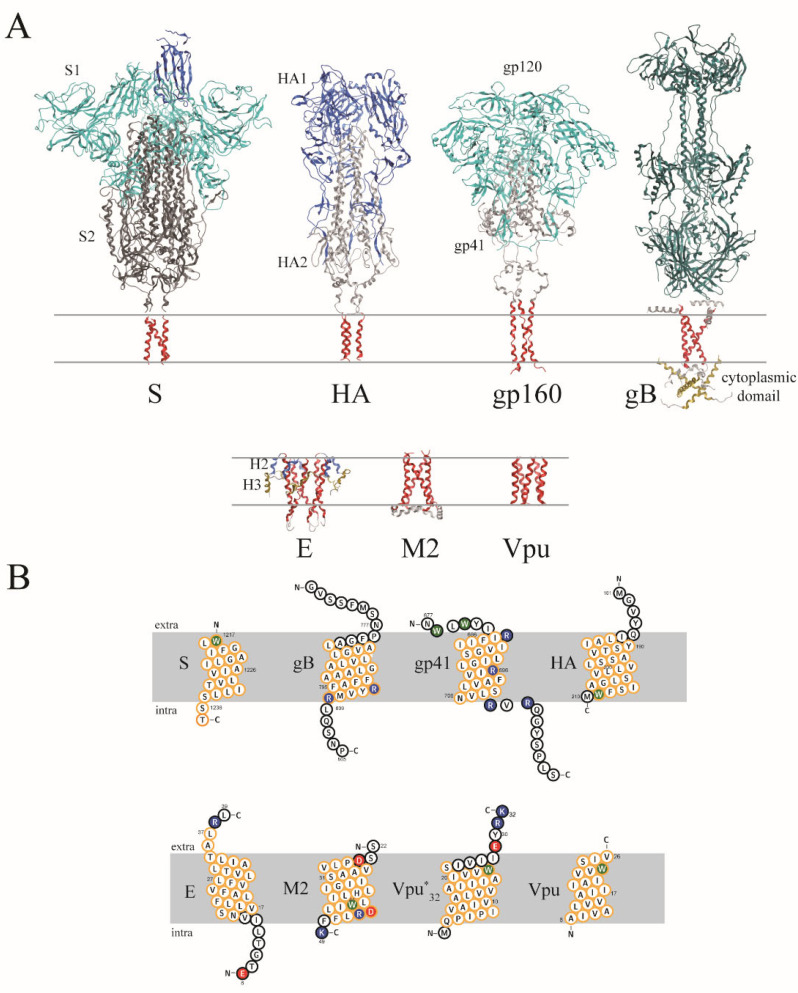
Figure 1.
(A) Models in their backbone representation of fusion proteins based on experimental data for S protein of S1 and parts of S2 (combined PDB ID: 6VSB and PDB ID: 7LC8 (TMD) for visualization only), haemagglutinin (PDB ID: 6HJQ), gB (PDB ID: 5V2S) and gp160 (combined use of PDB ID: 6PWU (gp120 and parts of gp41), and PDB ID: 6E8W (linker and transmembrane domain of gp41) for visualization only), as well as the viral channel forming proteins (VCPs) M2 (PDB ID: 2L0J), E protein (PDB ID: 5X29) and Vpu (PDB ID 1PI7). The TMDs are shown in red, while the extra-membrane domains are shown in different colors, highlighting the different subdomains. Different subunits of the proteins are marked as S1/2 or HA1/2. The lipid membrane is approximated by two lines. (B) The sequence and topology of the fusion proteins (upper row) and VCPs (lower row), which are used in the simulations, are shown using the program ‘Protter’. The residues assumed to be within the lipid membrane are embedded within the grey bar. Residues encircled in orange are residues chosen for the calculation of the diffusion coefficient using spp. Positively charged residues are shown in blue; the negatively charged residues in red. Tryptophan residues are highlighted in green. Extra-membrane residues are manually reorganized in the plots.

