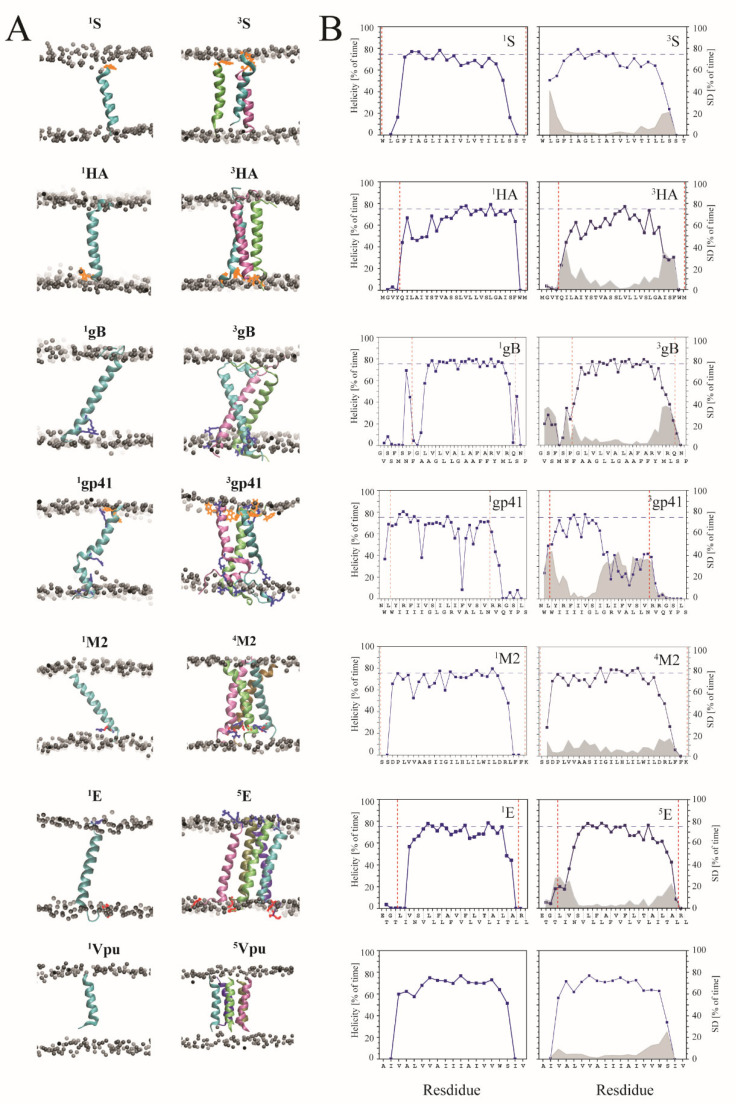
Figure 2.
(A) Structural models of the peptides in the monomeric and oligomeric state at the end of the 500 ns MD simulations of S protein (1S, 3S), HA (1HA, 3HA), gB (1gB, 3gB), gp41 (1gp41, 3gp41), M2 (1M2, 4M2), E peptide (1E, 5E), and Vpu peptide (1Vpu, 5Vpu). The structures were taken from experimentally available data. The boundaries of the lipid membrane are marked by grey spheres representing the phosphorous atoms of the lipid head groups. The remaining lipid atoms as well as the water molecules are omitted for clarity. (B) The corresponding percentage of time of each residue being in a helical conformation is shown for both monomer (left column) and oligomer with standard deviation in grey when averaging the values for each individual TMD (right column). Red dash lines indicate the boundaries of the lipid membrane.

