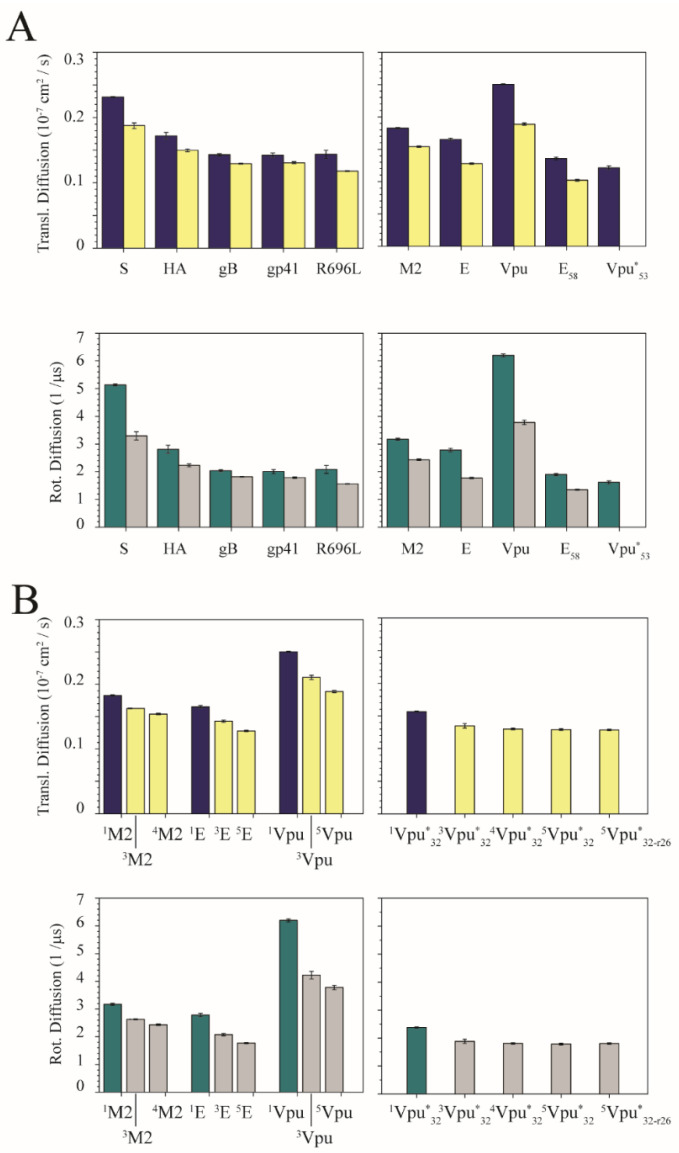
Figure 3.
(A) Translational (upper panel) and rotational diffusion coefficients (DCs) (lower panel) of fusion (left column) and channel peptides (right column) from MD simulations of the experimental structures. The data are calculated using lpp. The blue and green bars represent the data for the simulations of the monomers, while the yellow and grey bars represent the data of the oligomers (3 TMDs for each fusion protein; 4 TMDs for M2, and 5 TMDs for E and Vpu proteins). The subscripts for Vpu and E protein mark the number of amino acids used in the simulation. The star in Vpu*53 indicates that this structure is derived from an ideal helix (see Materials and Methods). (B) DCs for specific oligomeric structures using the same calculation (lpp) and color scheme as above. Left column shows the DCs of experimental ion channel peptides in monomeric and tetra-/pentameric states together with trimeric conformations, which are done by using the in-house software Prediction of Ion Channel Assemblies (PICA), by taking experimental monomers as building blocks for the assembly. Right column shows the PICA-generated oligomeric bundles by using the ideal monomeric structure of Vpu. The superscripts mark the oligomeric state which was used in the simulations. For 5Vpu*32, the tryptophan residues are pointing inside the pore, while r26 marks the respective pentameric bundle, 5Vpu*32-r26, which the tryptophan residues are pointing to outside the bundle leaving the S24 pointing inside the putative pore. This kind of orientation also appears in the trimeric and tetrameric bundles.

