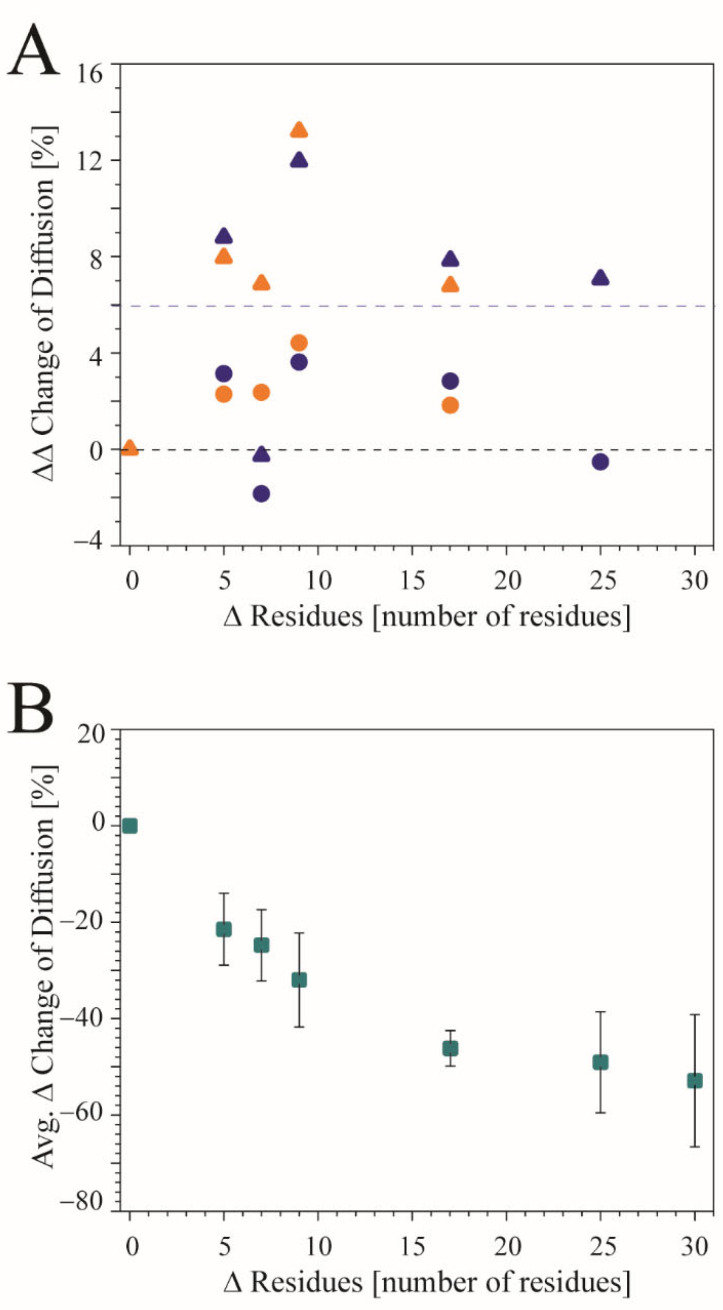
Figure 4.
(A) The percentage change (ΔΔ change) of the diffusion coefficients (DCs) between spp and lpp between monomeric and oligomeric states using the monomeric state as reference [(oligomeric state (lpp–spp))–(monomeric state (lpp–spp))]. The ΔΔ changes of DCs that are bigger than zero indicate that the decrease is larger between spp and lpp in the monomeric state than in the oligomeric state. Numbers smaller than zero indicate that the DCs decrease more between spp and lpp in the oligomeric state. The data do not discriminate between fusion and ion channel proteins. The blue and orange circles refer to the translational DCs taken from simulations of the experimental and ideal structures, respectively. The triangles refer to the respective rotational DCs (blue for experimental structures and orange for ideal structures). (B) Data of the differences in the DCs from the same amino acid number difference, Δ Residues, between two protocols, (lpp–spp) are averaged over all translational and rotational DCs independent of the type of peptide and oligomeric state.

