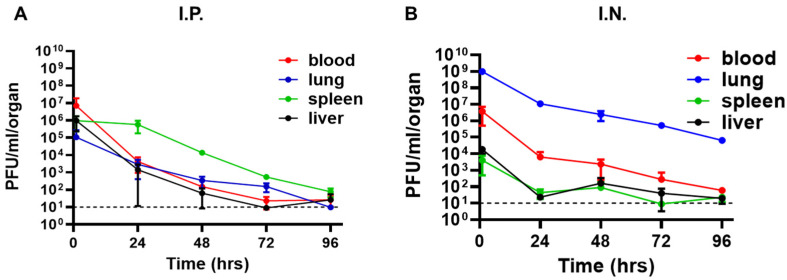
Figure 5.
Pharmacokinetic analysis of PST in naive mice. A single dose of PST phage suspension (1 × 10⁹ PFU) was administered to naive C57BL/6J mice, either by (A) IP injection (0.5 mL) or (B) via the IN route (35 µL). For each administration route, n = 3 for each time point. Phage titration was performed using a spot assay test. Each dot represents the mean value in terms of PFU/organ (lung—blue dots, spleen—green dots, liver—black dots) or PFU/mL blood (red dots). Bars represent the standard deviations (SDs).

