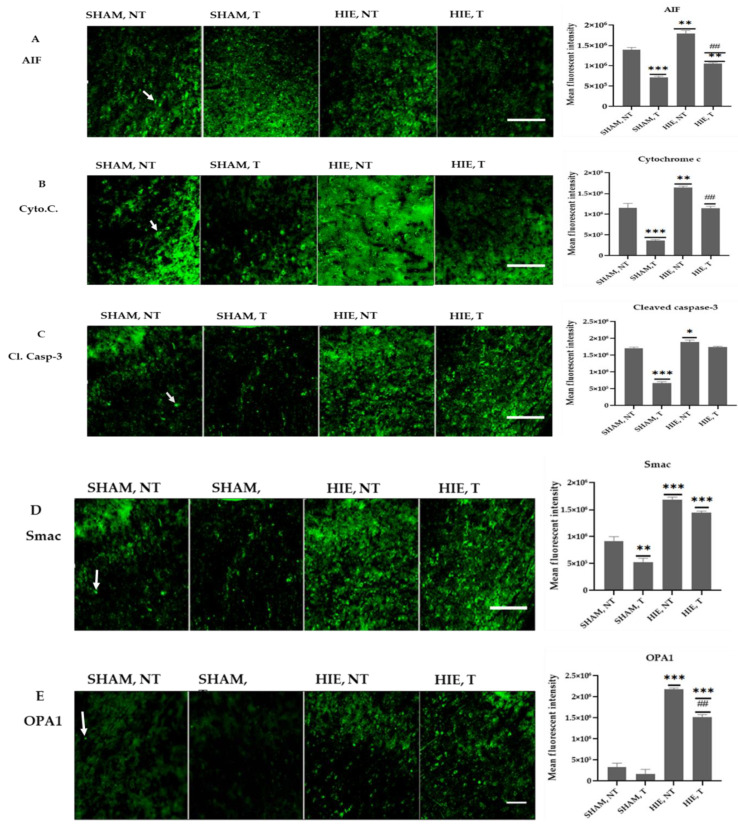
Figure 6.
Immunofluorescence images and mean fluorescent intensities of the proteins in the motor cortex. (A) Representative immunofluorescence images and MFI of AIF in the motor cortex of each group. AIF molecules are green. AIF molecules were analyzed in the motor cortex. Results are presented as the Mean ± SEM of 3 rats from each group. (** p < 0.001 and *** p < 0.0001) compared with the SHAM, NT group; (## p < 0.001 compared with the HIE, NT group; each group, n = 3). Scale bar, 100 µm. (B) Representative immunofluorescence images and MFI of Cytochrome C in the motor cortex of each group. Cytochrome C molecules (green) were analyzed in the motor cortex. Data are presented as the Mean ± SEM of 3 rats from each group. (** p < 0.001 and *** p < 0.0001) compared with the SHAM, NT group; (## p < 0.001 compared with the HIE, NT group); each group, n = 3. Scale bar, 100 µm. (C) Representative immunofluorescence images and MFI of Cleaved caspase-3 in the motor cortex of each group. Cleaved caspase-3 molecules (green) were analyzed in the motor cortex. Results are presented as the Mean ± SEM of 3 rats from each group. (* p < 0.05 and *** p < 0.0001) compared with the SHAM, NT group); each group, n = 3. Scale bar, 100 µm. (D) Representative immunofluorescence images and MFI of SMAC in the motor cortex of each group. SMAC molecules (green) were analyzed in the motor cortex. Results are presented as the Mean ± SEM of 3 rats of each group. (** p < 0.001 and *** p < 0.0001) compared with the SHAM, NT group); each group, n = 3. Scale bar, 100 µm. (E) Representative immunofluorescence images and MFI of OPA1 in the motor cortex of each group. OPA1 molecules (green) were analyzed in the motor cortex. Individual data are presented as the Mean ± SEM from 3 rats in each group. (*** p < 0.0001) compared with the SHAM-NT group; (## p < 0.001 compared with the HIE, NT group); each group, n = 3. Scale bar, 100 µm.

