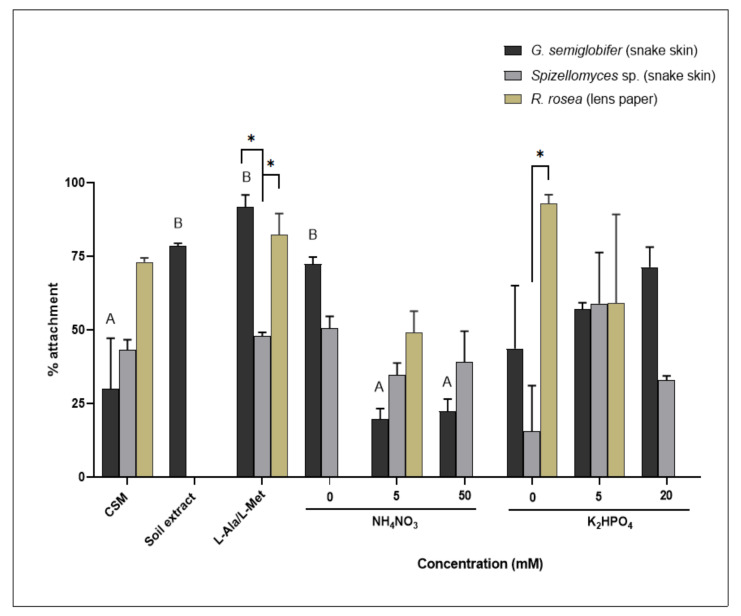
Figure 6.
Percentage attachment of chytrid sporangia to baits (snake skin or lens paper). Error bars are SEM. Significant differences were observed between the nitrogen treatments (F5, 36 = 32.19, p < 0.05) and denoted by capital letters (A, B), but no significant changes were found in the phosphate series (F4, 30 = 3.343, p > 0.05). Significance found between isolates (F2, 36 = 18.08, p < 0.05) is denoted by an asterix (∗).

