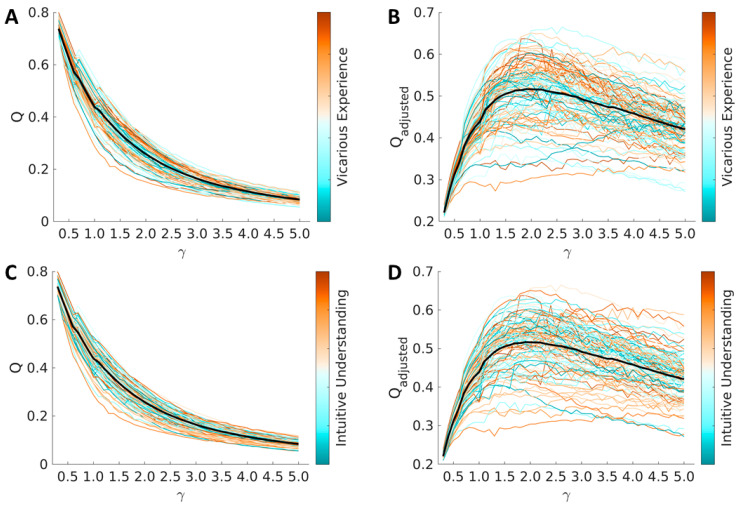
Figure 2.
Modularity (A,C) and adjusted modularity (B,D) are represented both with average values (thick black line) and with single-subject values (thin colored lines). In (A,B), increased values of vicarious understanding are represented with more intense green colors. In (C,D), increased values of intuitive understanding are represented with more intense purple colors. As the figures show, and as described in the main text, modularity was not associated with vicarious experience or intuitive understanding.

