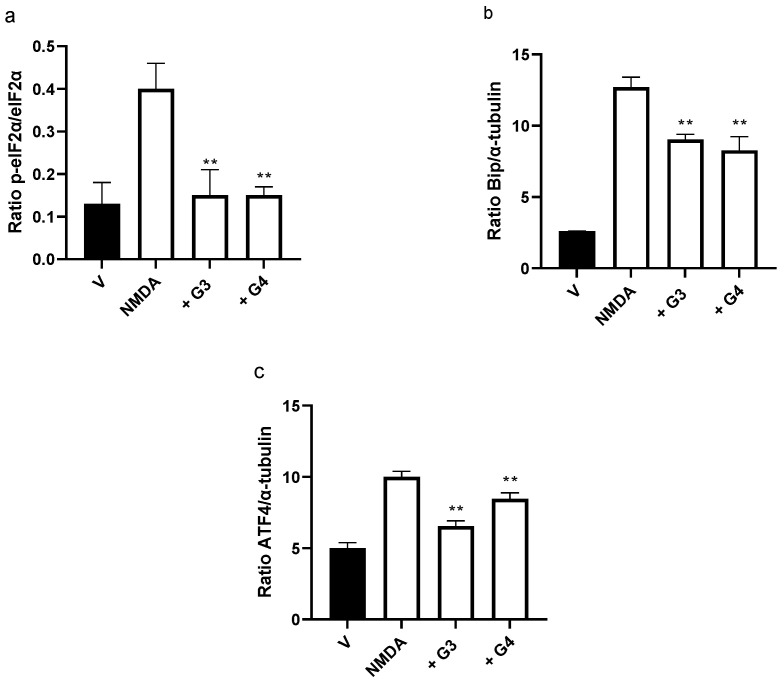
Figure 6.
Quantification of the effect of phosphorous dendrimers on NMDA-induced changes in ER stress proteins. Neurons were treated with vehicle (V) or with 10 µM of G3 or G4 phosphorous dendrimers for 1 h. Then, NMDA (150 µM) was added and incubation continued for another 1 h for (a) p-eiF2α and eiF2α determination and for 6 h for (b) Bip and (c) ATF4 determination. α-Tubulin was used as loading control. The data are expressed as the mean + the s.e.m. of three experiments. ** p < 0.01 as compared to NMDA-treated cells in the absence of dendrimers.

