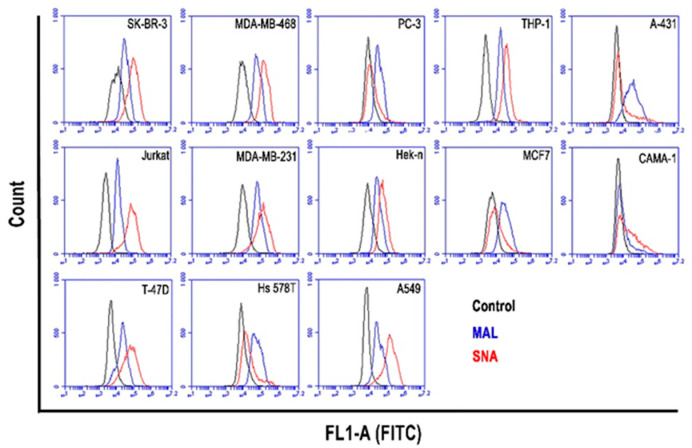
Figure 1.
MAL I (α2,3-SA) and SNA (α2,6-SA) lectin binding to the thirteen cancer cell lines. Both lectins were used at a concentration of 5 µg/mL. The flow cytometry histograms show the mean fluorescence intensity (MFI) of unstained control cells (black lines) and lectin-stained cells (blue lines for MAL I and red lines for SNA). One representative experiment out of two performed is shown.

