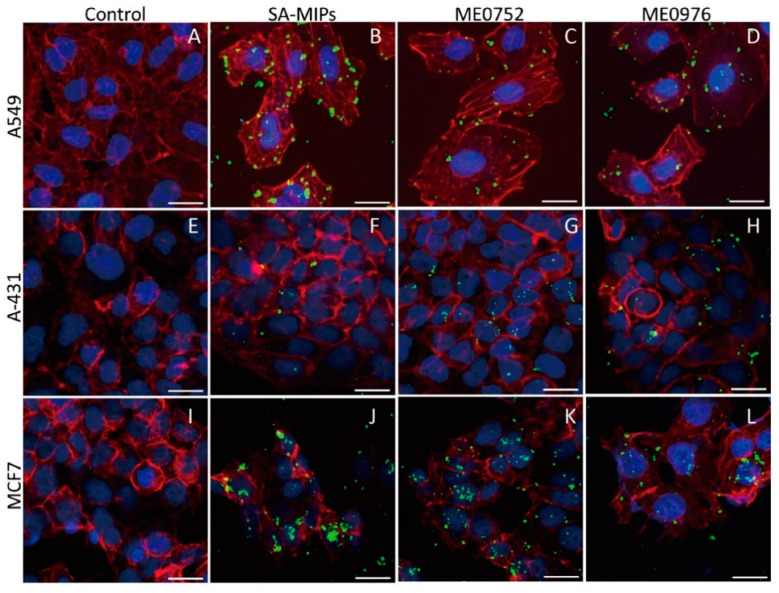
Figure 4.
Confocal fluorescence microscopy images of SA-MIPs staining for three different cancer cell lines. A549 (A–D), A-431 (E–H), and MCF7 (I–L) were stained with SA-MIPs (B,F,J) in green, rhodamine-phalloidin (actin filaments) in red and DAPI (nuclei) in blue. The two columns on the right show staining with SA-MIPs after pre-treatment with the 200 µM of SA conjugates ME0752 (C,G,K) and ME0976 (D,H,L). Scale bar: 20 µm.

