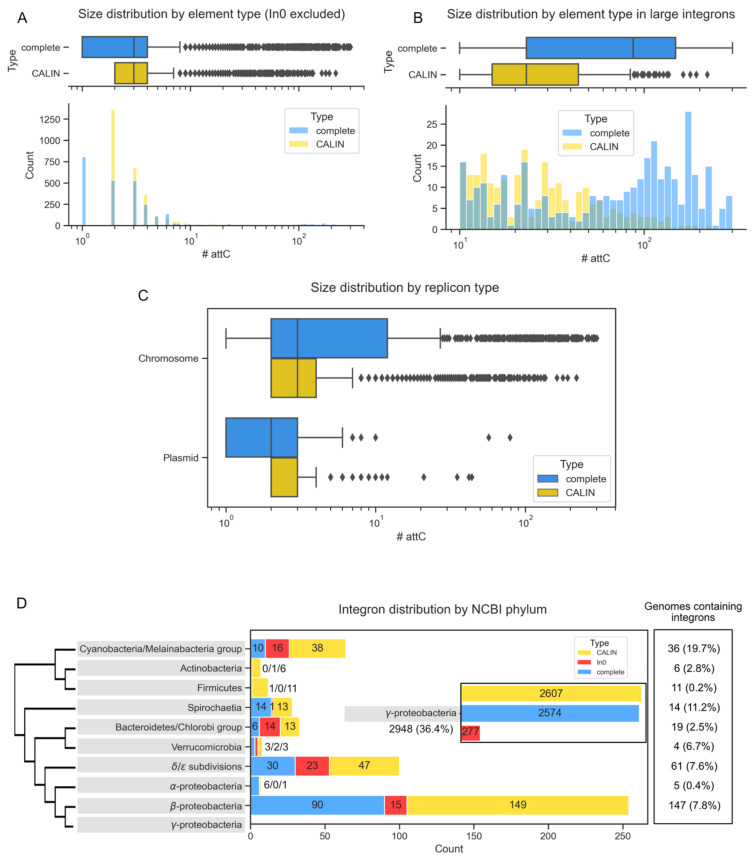
Figure 2.
Statistics concerning the distribution of integrons in the RefSeq NCBI database. Distribution of the number of attC sites found per element (complete integron or CALIN) (A) and zoom on the distribution of large elements (>10 sites, B). Distribution of number of attC sites per type of integron and replicon (C). Distribution of integrons across major bacterial phyla. Only phyla comprising integrons are shown. The percentage in the last box is the proportion of the genomes in our database that contain at least one integron (D).

