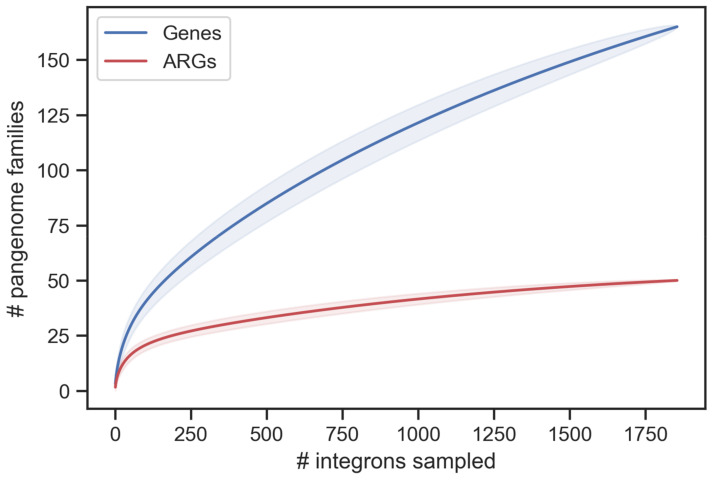
Figure 4.
Analysis of the pangenome of the integrons of Kpn. The figure displays two saturation curves, representing the expected (mean) gene richness when increasing the number of integrons. They were computed using the Mao Tau estimate (see Methods for more details). The shadowed regions correspond to one standard deviation.

