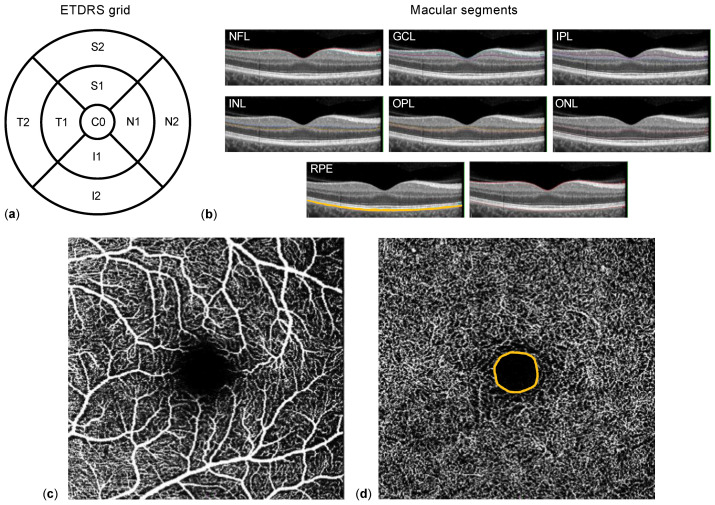
Figure 1.
Methodology. (a) The Early Treatment Diabetic Retinopathy Study (ETDRS) grid 1, 2.22, 3.45 mm, consisting of nine subfields (C0: center; S1 and S2 superior, N1 and N2 nasal, I1 and I2 inferior, and T1 and T2 temporal). Macular segments (b) are separated semi-automatically by the optical coherence tomography (OCT) software: nerve fiber layer (NFL), ganglion cell layer (GCL), inner plexiform layer (IPL), inner nuclear layer (INL), outer plexiform layer (OPL), outer nuclear layer (ONL), and retinal pigment epithelium (RPE). OCT-angiography example of the superficial (c) and deep (d) capillary plexus of the macula; the orange line indicates the borders of foveal avascular zone.

