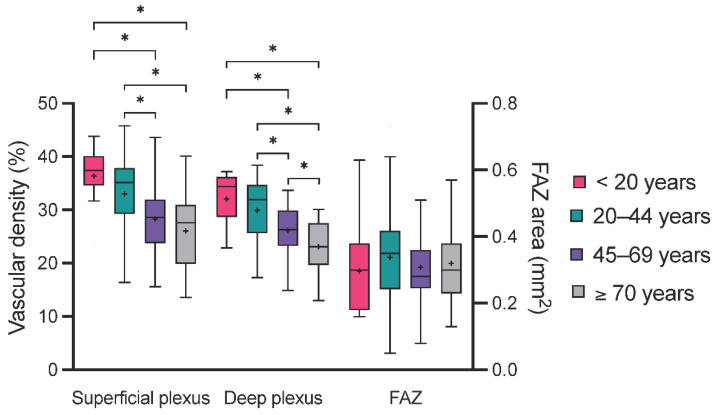
Figure 3.
Comparison of OCTA parameters between age groups. The box plots represent the distribution of the vascular density of the superficial and deep plexus as well as of the foveal avascular zone (FAZ) area in all four age groups. Statistically different results in the analysis of variance are represented with an asterisk (*), the mean value is presented with a cross (+).

