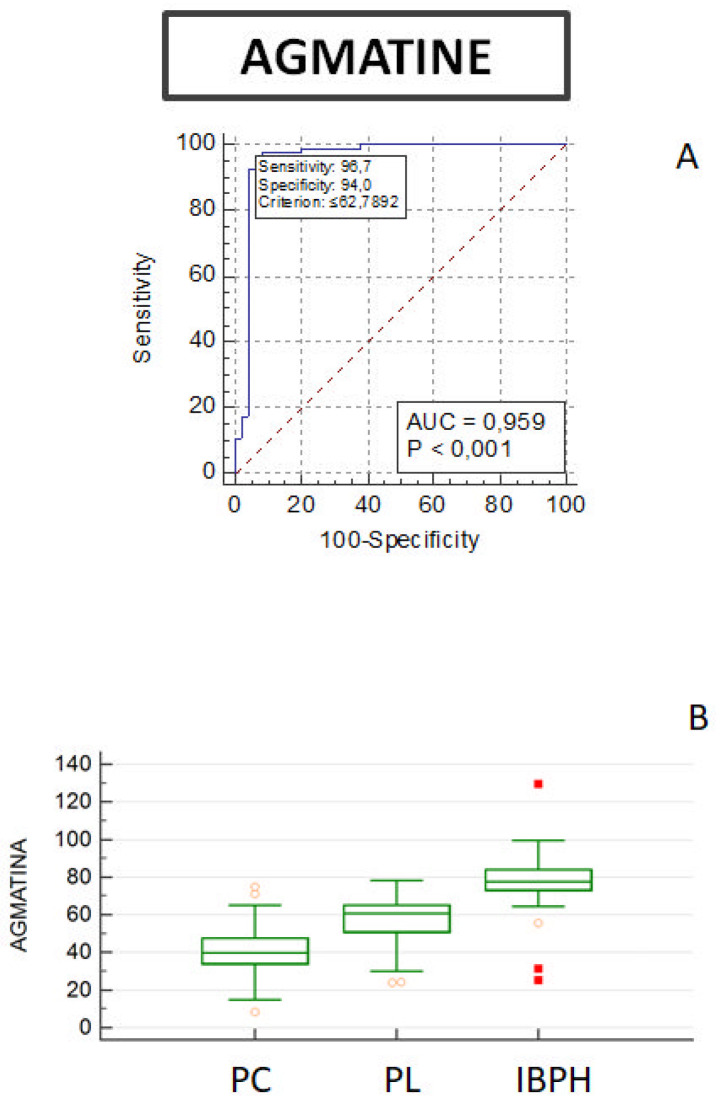
Figure 6.
(A) ROC curve diagram of agmatine sensitivity and specificity in prediction of pathological conditions in PC and BPH patients. (B) Boxplots showing the distribution of agmatine among subjects with prostate cancer (PC, n = 92), precancerous lesions (PL, n = 26), or benign prostatic hyperplasia (BPH, n = 49). The centre line of the boxplots indicates the median (limits of the box indicate the 25th and 75th percentile). The whiskers represent either 1.5 times the interquartile range (IQR) or the maximum/minimum data point if they are within 1.5 times the IQR. Wilcoxon’s test was used to compare mean agmatine levels among groups.

