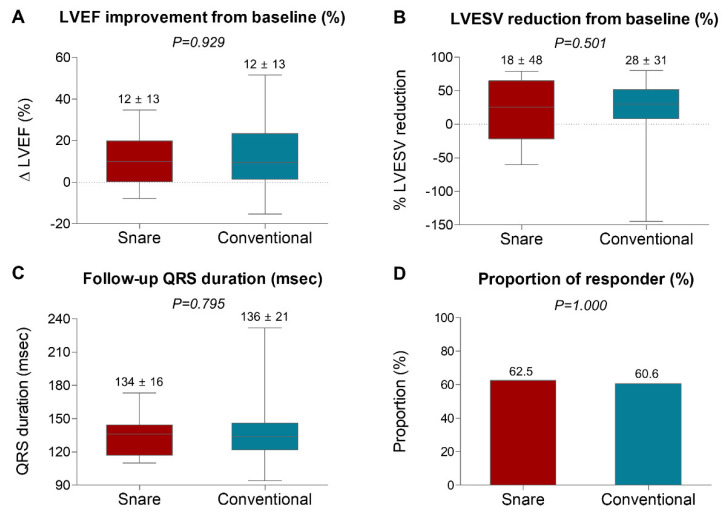
Figure 5.
Comparison of Electrocardiographic and Echocardiographic Responses between the Snare and Conventional Groups. (A) Absolute increase in LVEF, (B) relative reduction in LVESV, (C) follow-up QRS duration (msec), and (D) responder rates (%) are compared between the snare and conventional groups. Values are mean ± standard deviation or proportion (%). In box-and-whisker plots, horizontal line indicates median value, box indicates the interquartile range, and whiskers indicate the minimum and maximum values excluding outliers. LVEF, left ventricular ejection fraction; LVESV, left ventricular end-systolic volume.

