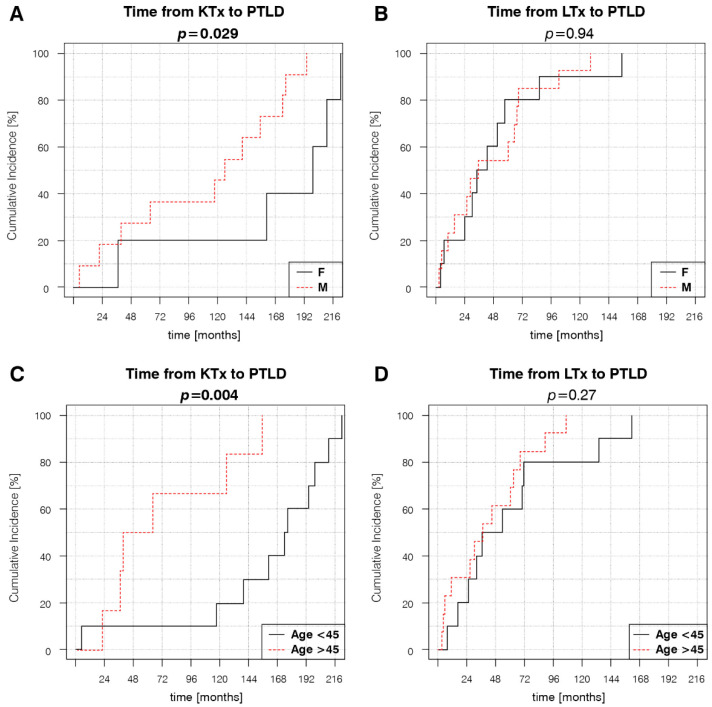
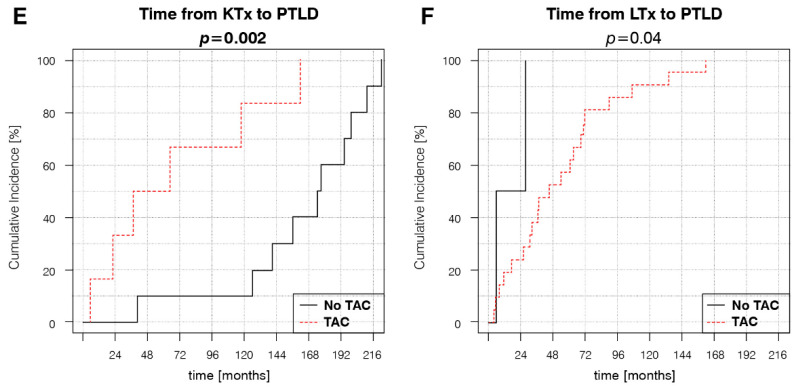
Figure 2.
Transplanted organ-dependent effect of different variables on PTLD development: (A) KTR sex, (B) LTR sex, (C) KTR age at transplantation, (D) LTR age at transplantation, (E) Presence of TAC in KTR IS regimens at PTLD diagnosis, (F) Presence of TAC in LTR IS regimens at PTLD diagnosis. p-values represent the log-rank analysis of the Kaplan–Meier estimator curves.


