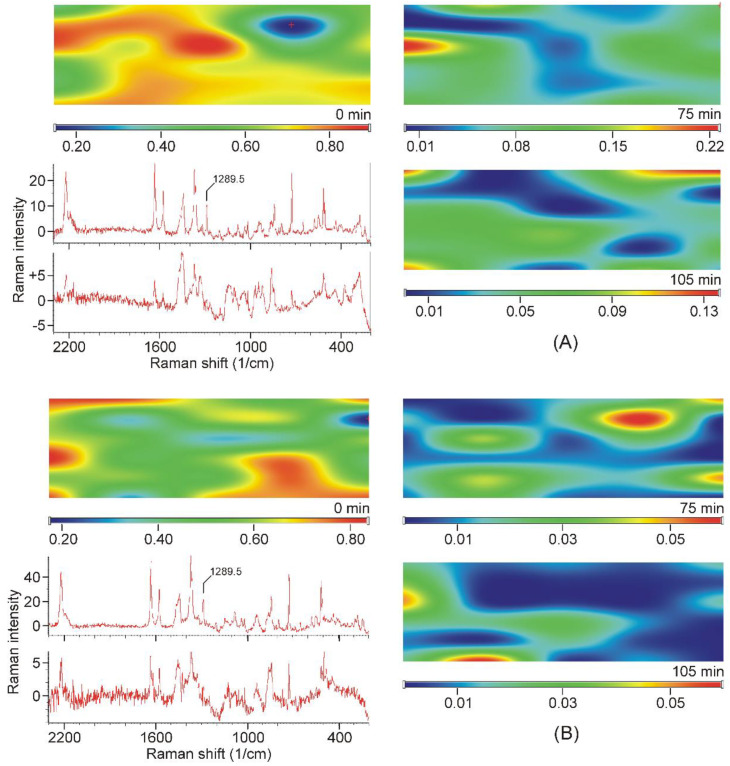
Figure 9.
Examples of Raman-intensity maps constructed from the Raman spectra recorded at the grid points, using the intensities at 1289.5 cm−1 of the TER-DIMEB (A) and the TER-HPBCD mixture (B). Top left corner: Mixture of the starting materials. On the right: The maps of the samples taken in the final stage of grinding. Bottom left: Upper spectrum recorded in the high-intensity area of the map of the non-grinded mixture. Lower spectrum recorded at the low-intensity area of the map of the sample ground for 75 min (position marked with a red cross).

