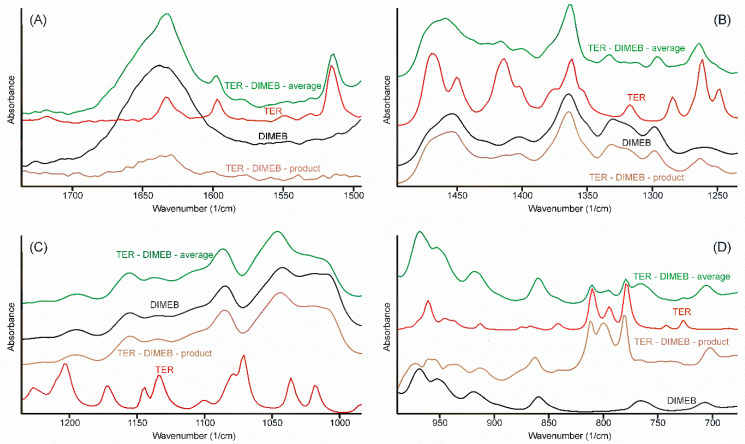
Figure 10.
Construction of the FTIR spectrum (regions 1750–1495; 1495–1230; 1430–990; és 990–675 cm−1 (A–D) respectively) of the product in the TER-DIMEB system, by successive subtraction of the spectra of the starting materials from the average spectrum of the samples taken at various times of the grinding process. The spectrum of the product resembled the spectrum of DIMEB. Only the out-of-plane deformation bands of TER can be seen at 809, 798, and 778 cm−1, somewhat shifted. All other bands of TER disappeared, including the tertiary ammonium band (not shown in the Figure).

