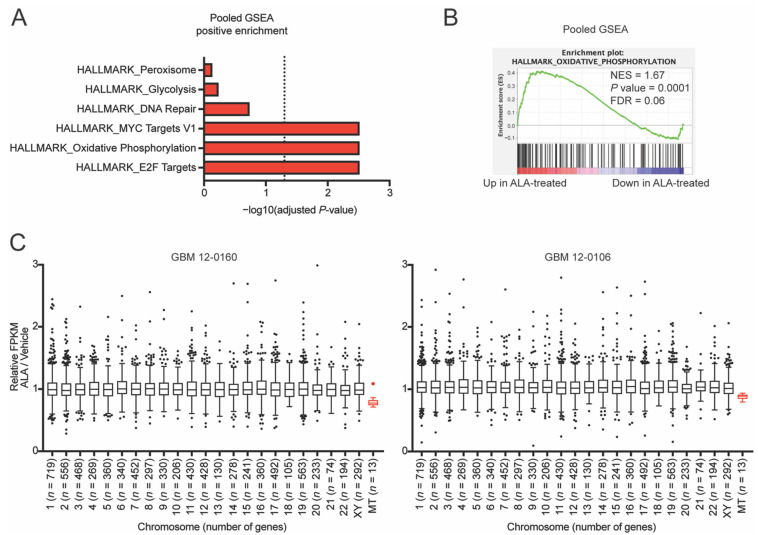
Figure 2.
Inhibition of de novo purine synthesis using L-Alanosine (ALA) alters glioblastoma (GBM) cells’ oxidative phosphorylation genes and mtDNA gene expression. (A) Gene set enrichment analysis (GSEA) of pooled mRNA-seq of GBM 12-0160 and GBM 12-0106 cells pretreated for 2 weeks with ALA 0.25 µM highlights positively enriched Hallmark pathways; dashed line represents p = 0.05. (B) GSEA enrichment plots for oxidative phosphorylation show a positive enrichment with ALA treatment. (C) Individually analyzed mRNA-seq shows that ALA decreases expression of mitochondrial DNA-encoded (MT) genes (shown in red). Genes with FPKM of at least 10 were included in analysis. Outlier genes (n = 3 genes) excluded from plot for data visualization purposes. p < 0.0001 for MT vs. each other chromosome. Data shown are mean +/− SEM. Data analyzed using Mann-Whitney test (C).

