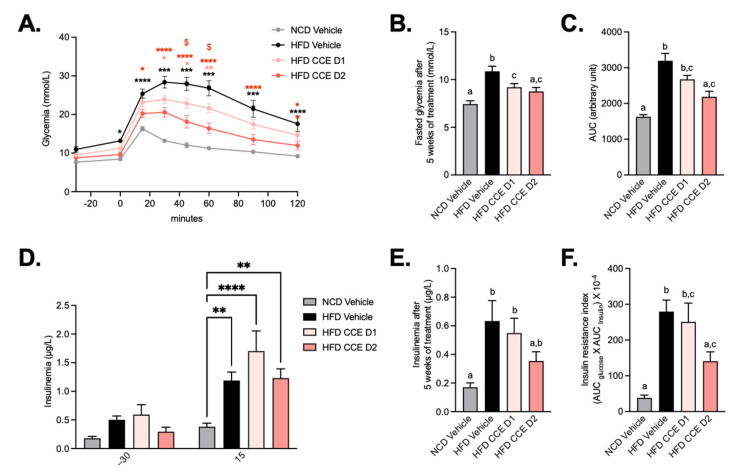
Figure 2.
Camu-Camu improves glucose tolerance in diet-induced obese mice in a dose-dependent manner. Effects of oral administration of vehicle or CCE in 6-hour-fasted mice on (A) oral glucose tolerance test (OGTT), glycemia before and after an oral load of glucose (2 g/kg of body weight) after 4 weeks of treatment * p < 0.05, ** p < 0.01, **** p < 0.0001 vs. HFD vehicle and $ p < 0.05 HFD CCE D1 vs. HFD CCE D2 based on 2-way ANOVA followed by Bonferroni’s post hoc test, (B) fasted glycemia at the necropsy after 5 weeks of treatment, (C) glucose area-under-the-curve (AUC) measured during the OGTT after 4 weeks of treatment, (D) insulinemia 30 min before and 15 min after an oral load of glucose after 4 weeks of treatment, ** p < 0.01, **** p < 0.0001 vs. HFD vehicle based on 2-way ANOVA followed by Bonferroni’s post hoc test, (E) insulinemia at the necropsy after 5 weeks of treatment, (F) insulin resistance index determined by multiplying the AUC of blood glucose by the AUC of insulin between 30 min before and 15 min after glucose loading after 4 weeks of treatment, n = 9–10 per group. In figures (B,C,E,F), data with different superscript letters are significantly different (p < 0.05) according to post hoc ANOVA one-way statistical analysis (Bonferroni’s post hoc test). In panel (A), only statistics vs. HFD vehicle were presented in the graph. The other significant comparisons were: *** p < 0.001 after 15 min, **** p < 0.0001 after 30 min, **** p < 0.0001 after 45 min, **** p < 0.0001 after 60 min, **** p < 0.0001 after 90 min, and ** p < 0.01 after 120 min for HFD CCE D1 vs. NCD vehicle and **** p < 0.0001 after 30 min, ** p < 0.01 after 45 min, and * p < 0.05 after 60 min for HFD CCE D2 vs. NCD vehicle.

