Figure 2.

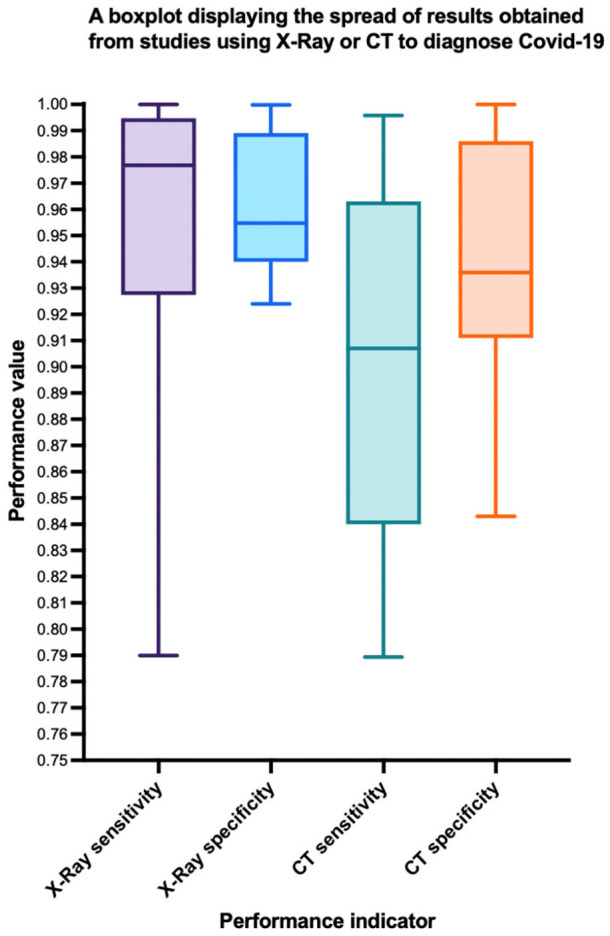
Box plot displaying the spread of results from CT and X-ray models. Interquartile range is demonstrated by the box, with the median value in the center. Whiskers display extremes at either ends.

Box plot displaying the spread of results from CT and X-ray models. Interquartile range is demonstrated by the box, with the median value in the center. Whiskers display extremes at either ends.