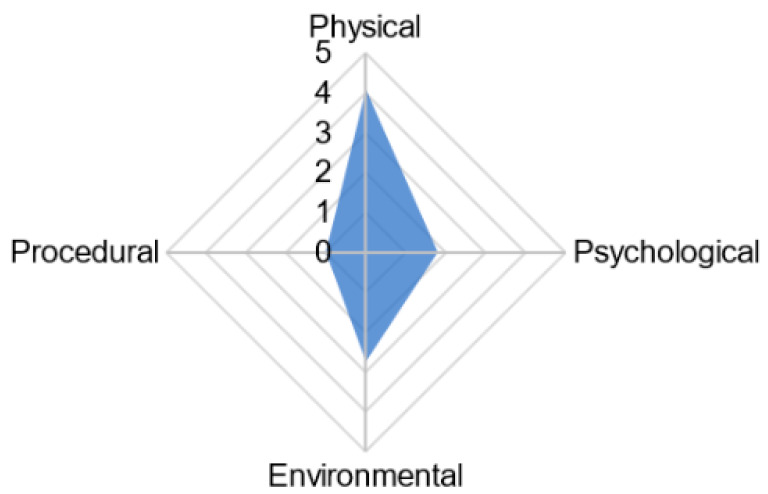
Figure 1.
Radar chart illustrating visualization of animal welfare data by using averages of the four parameter classes of physical, procedural, environmental, and psychological to form a polygon. The CWAS is represented by the surface area of this chart. Reproduced from Brouwers, Stijn and Duchateau, Marie José 2021, “Feasibility and validity of the Animal Welfare Assessment Grid to monitor the welfare of zoo-housed gorillas Gorilla gorilla gorilla”. Journal of Zoo and Aquarium Research 9(4):208. Reprinted under a Creative Commons Attribution CC BY 4.0 license.

