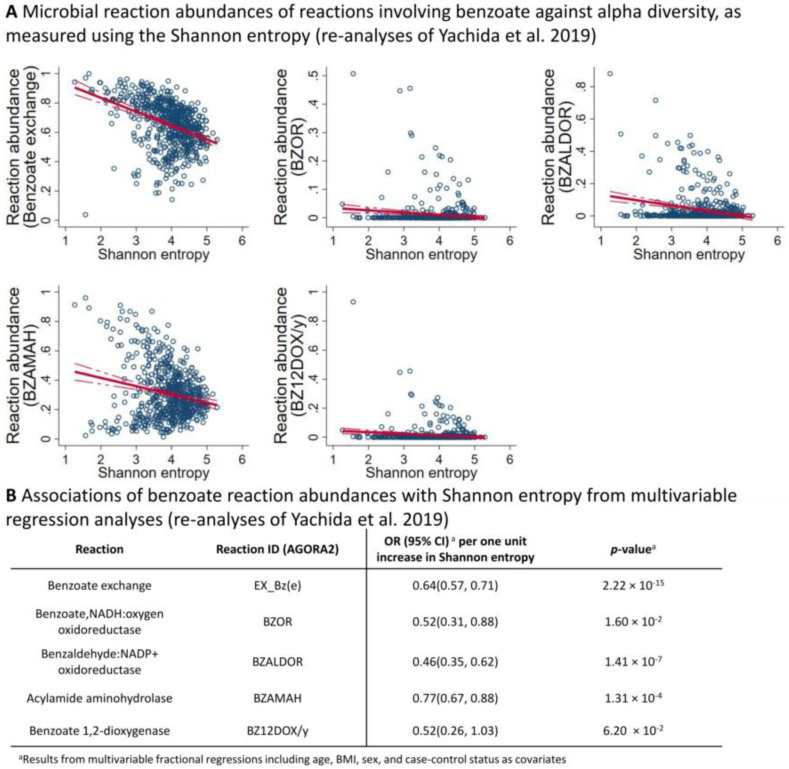
Figure 4.
Overview of the results regarding reaction abundances after functional annotation of the Yachida et al. dataset using AGORA2. (A) Scatter plots of reaction abundances against the Shannon entropy of metagenomes after mapping onto AGORA2. A red line indicates the linear regression line, where the dashed red lines display the 95% confidence interval. All displayed associations had a false discovery rate < 0.05. (B) Table displaying the reaction abundance Shannon entropy associations for benzoate-producing, -degrading, or -transporting reactions noted in AGORA2. OR—odds ratio; 95% CI—95% confidence interval.

