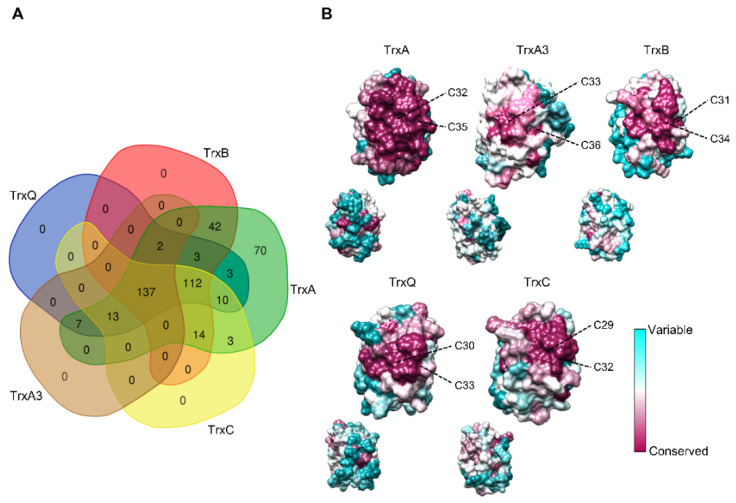
Figure 2.
Distribution and conservation of cyanobacterial Trxs. (A) Venn diagram showing co-occurrence of Trxs in cyanobacteria analyzed. The specific cyanobacteria for each category are available in the Table S1. (B) Residue-based conservation score plotted for models of TrxA1/2, TrxA3, TrxB, TrxQ, and TrxC. Residues are colored according to conservation scores ranging from 1 (cyan, least conserved) to 9 (purple, most conserved). The active-site cysteines are indicated for each model.

