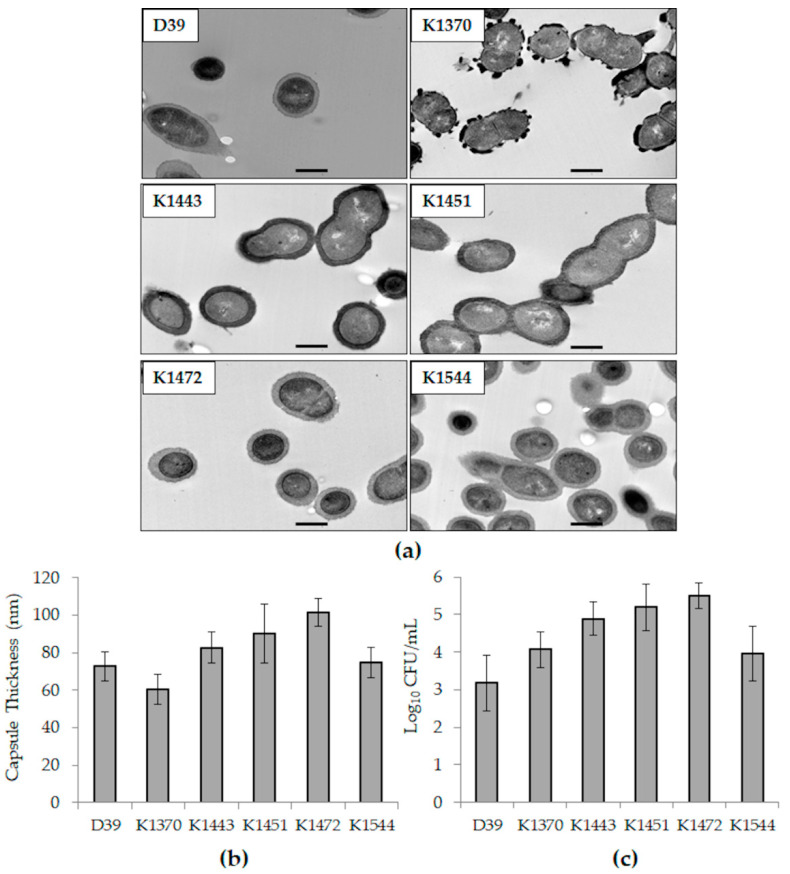
Figure 1.
Capsules thickness and relative host cell adhesion of the strains included in this study. (a) TEM images of each strain. The bar in each panel represents a length of 500 nm; (b) average capsule thicknesses as measured from TEM images; (c) average log CFU/mL bound to HCECs. Error bars represent standard deviation.

