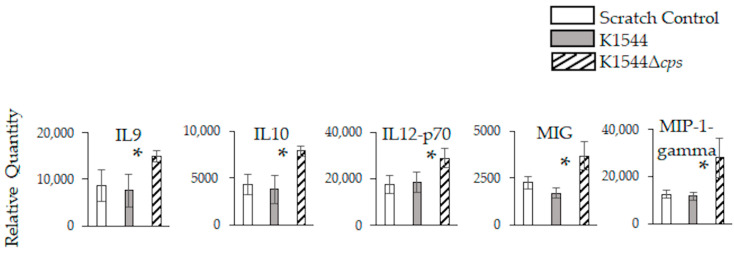
Figure 5.
Inflammation-associated markers in mouse eyes 24 h after infection. Relative quantities are expressed as intensity values generated by ImageJ software. Error bars represent standard deviation. Asterisks indicate a significant difference between parent and mutant. Significant differences were detected only at 24 h.

