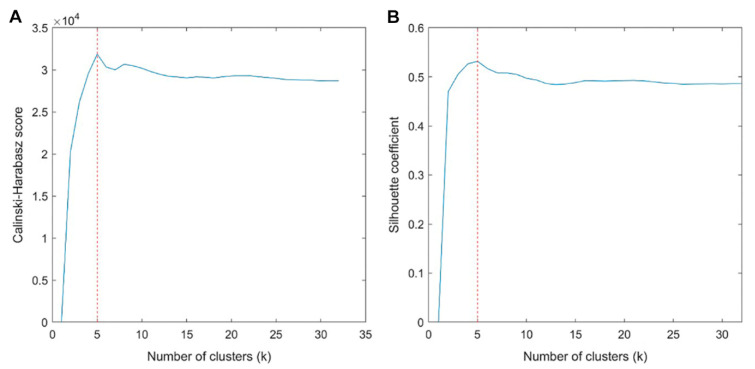
Figure 2.
Calinski-Harabasz score plot (A) and Silhouette coefficient plots (B) to determine the optimal number of subregions (habitats). The values are averaged values from 100 repetitions. The red dotted line is the optimal value beyond which the scores started to decrease. The optimal number of clusters was determined as five.

