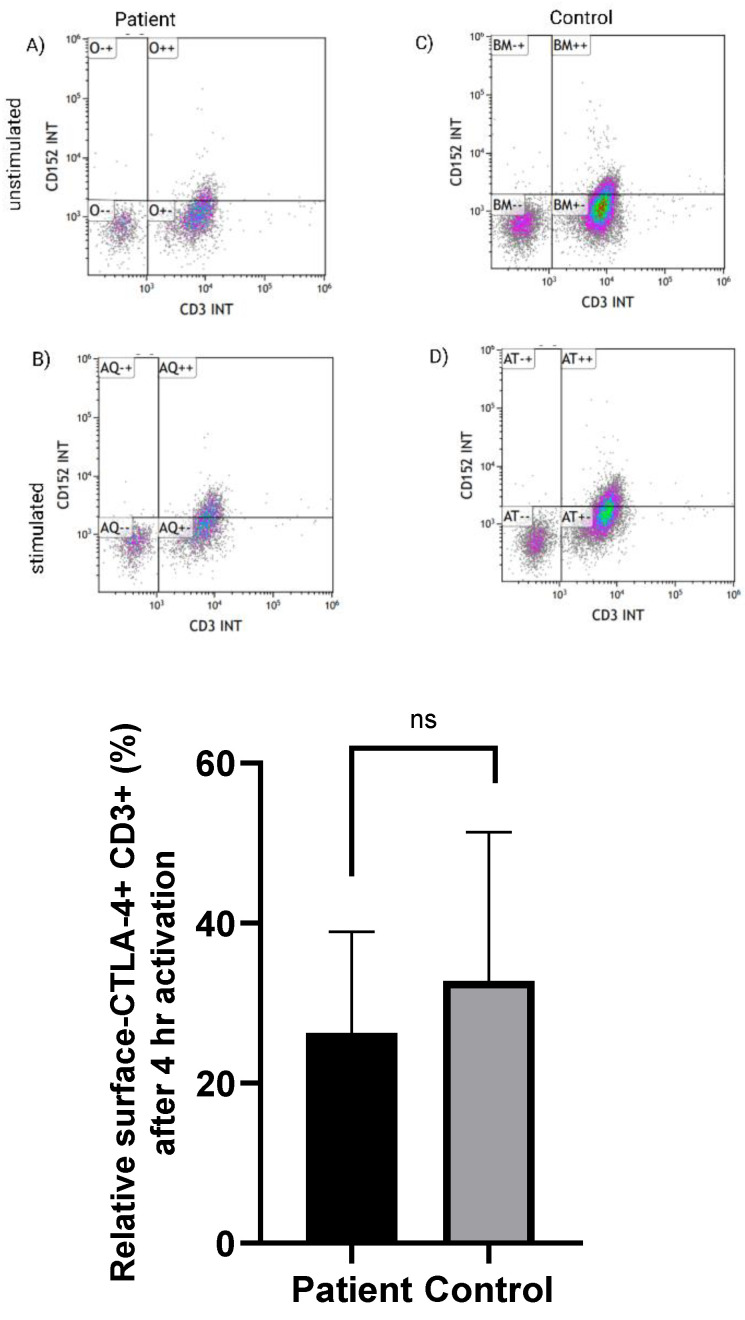
Figure 2.
Relative CTLA-4 expression, gated on CD3+ cells. The expression of CTLA-4 on the surface of CD3+ T-cells in the proband, 4 h following activation, was none-significantly different (p = 0.642) compared to the control. The median between two groups was compared using Mann-Whitney U test. Error bars represent standard error of the means (±SEM). ns: non significant. Paired parametric t test was used. The flowcytometry images represent the CD3+ CTLA-4+ T cells in (A) basal level and (B) after 4 h of stimulation with PMA/ionomycin in the proband. (C,D) represent the flowcytometry in the healthy control at the basal and after 4 h of stimulation, respectively.

